- Published on
Deploying monitoring TIG stack (Telegraf, InfluxDB and Grafana) on Raspberry Pi Kubernetes cluster
- Authors

- Name
- Peter Peerdeman
- @peterpeerdeman
An important part of maintaining a raspberry pi cluster is making sure it is running smoothly. We can keep an eye on the health of our nodes using a monitoring TIG stack, consisting of telegraf, influx and grafana. (Feel free to try out prometheus, but I just can't help being a bit of an influx and grafana fanboy)
timeseries database: influx
Let's start with the timeseries database. Since and influxdb 3 (or "edge") is not out yet and I'm not a big fan of flux queries in influxdb2, I'll be using influxdb 1.8.10.
We use the official influxdb helm charts and values file, and make small changes to the values.yml file.
First, we uncomment the readiness probe section and raise the periodSeconds to give a little bit more time for our raspberry pi's to start the service before retrying too soon.
readinessProbe:
  path: "/health"
  scheme: "HTTP"
  initialDelaySeconds: 0
  periodSeconds: 10
  timeoutSeconds: 1
  successThreshold: 1
  failureThreshold: 3
Next, we modify the persistence section to make use of our longhorn persistence storageclass
persistence:
  enabled: true
  ## A manually managed Persistent Volume and Claim
  ## Requires persistence.enabled: true
  ## If defined, PVC must be created manually before volume will be bound
  # existingClaim:
  ## influxdb data Persistent Volume Storage Class
  ## If defined, storageClassName: <storageClass>
  ## If set to "-", storageClassName: "", which disables dynamic provisioning
  ## If undefined (the default) or set to null, no storageClassName spec is
  ##   set, choosing the default provisioner.  (gp2 on AWS, standard on
  ##   GKE, AWS & OpenStack)
  ##
  storageClass: "longhorn"
  annotations: {}
  accessMode: ReadWriteOnce
  size: 3Gi
Before installing, we should create a namespace for all our monitoring services, to ensure all the services can reach eachother and that they don't get in the way of other applications. Create a new "monitoring" namespace with the command kubectl create ns monitoring
Then, install the deployment into the new namespace with helm install influxdb -n monitoring -f values.yaml influxdata/influxdb
metrics collection: telegraf
Next up, we want to feed influx with some metrics. Again, we use the official telegraf daemonset helm charts. An interesting note here is that instead of configuring a pod, this chart configures a "daemonset", because we want to have separate pods running on each of the nodes to collect individual metrics.
Since we named our influxdb deployment "influxdb" we don't even need to modify the url telegraf posts to by default: "http://influxdb.monitoring.svc:8086". We've got two minor modifications: 1. omitting the -alpine from the image tag, as the alpine images are not built for our raspberry pi arm64 architectures and 2. clearing the docker_endpoint variable, since telegraf cannot access the docker endpoint on the nodes directly. Copy the values.yaml file from the telegraf-ds helm repo, Change the image.repo variable so it looks like this snippet:
## Default values.yaml for Telegraf
## This is a YAML-formatted file.
## ref: https://hub.docker.com/r/library/telegraf/tags/

image:
  repo: "telegraf"
  tag: "1.29"
  pullPolicy: IfNotPresent
...
  docker_endpoint: ""
We can now run the install command with the right namespace and values file to install telegraf to each of the nodes.
helm install telegraf-ds -n monioring -f values.yaml influxdata/telegraf-ds
dashboarding: grafana
Last up is the visualisation of the dashboards. For that we will use the official grafana helm charts, and modify the values.yml slightly to enable persistence with longhorn and reduce the default disk size.
persistence:
  type: pvc
  enabled: true
  storageClassName: longhorn
  accessModes:
    - ReadWriteOnce
  size: 512Mi
  # annotations: {}
  finalizers:
    - kubernetes.io/pvc-protection
  # selectorLabels: {}
  ## Sub-directory of the PV to mount. Can be templated.
  # subPath: ""
  ## Name of an existing PVC. Can be templated.
  # existingClaim:
  ## Extra labels to apply to a PVC.
  extraPvcLabels: {}
we can now install the chart into the monitoring namespace as follows
helm repo add grafana https://grafana.github.io/helm-charts
helm repo update
helm install grafana -n monitoring grafana/grafana
when installed, we get a nice hint on how we can retrieve the grafana admin password, as this is being generated and saved to a kubernetes secret, encoded as base64. We retrieve the secret with the following command:
kubectl get secret --namespace monitoring grafana -o jsonpath="{.data.admin-password}" | base64 --decode ; echo
we can now forward the grafana tunnel and finally check out the glorious dashboarding application through our localhost:
kubectl port-forward -n monitoring svc/grafana :80
importing the telegraf statistics dashboard
After we are greeted with the grafana dashboard, we create a new datasource to access the influx data: menu / connections / add a new connection.
We then select influxdb, and fill in the following details
- name: telegraf
- host: http://influxdb:8086
- database: telegraf
Now click the "save & test" button at the bottom, this should now show that a number of measurements were found.
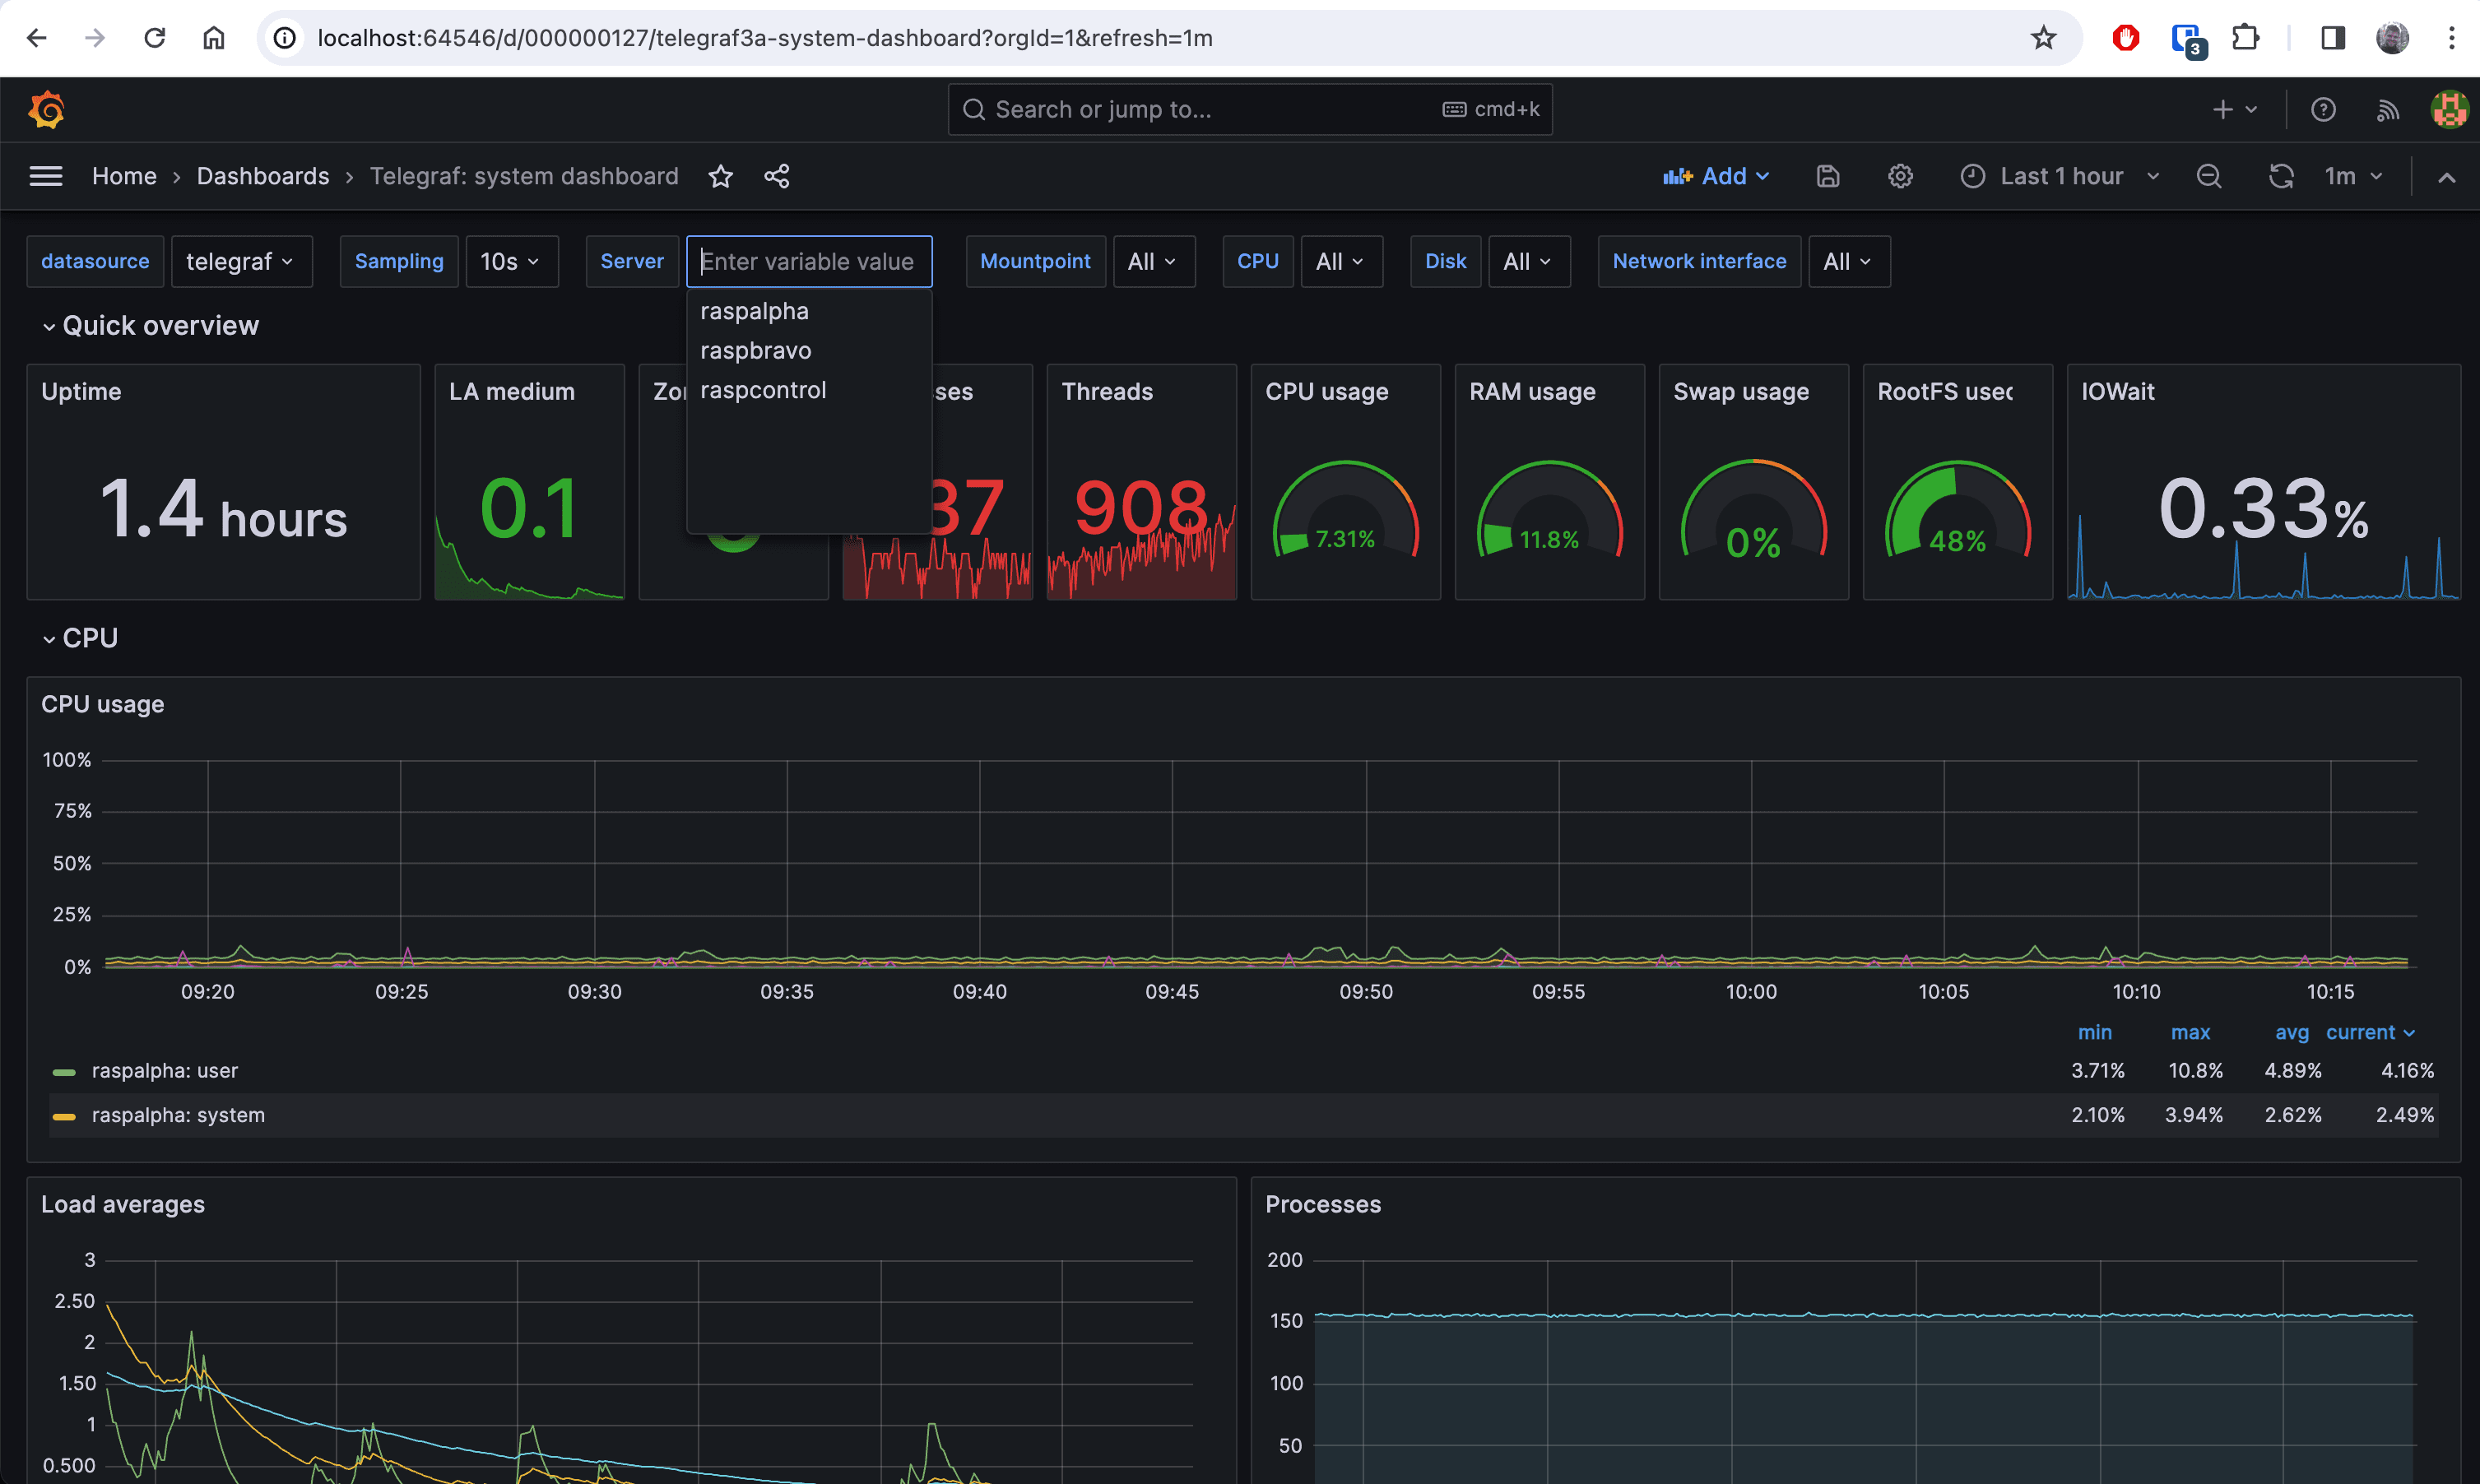
Go back to the homepage, and now go to the menu / dashboards. We now select new, choose import and use id import 928, the Telegraf: system dashboard and select "telegraf" as the datasource.
We can now get incredibly detailed stats on each of the nodes in the cluster. Whilst trying this setup, I found there is not great support for kubernetes dashboards in the classic Telegraf Influx Grafana stack, so I'll be looking into other monitoring setups such as Loki and Komodor next.
Check the other blogs in this raspberry pi kubernetes cluster series here:
- Kubernetes cluster build with Raspberry Pi nodes and PoE Hats in a DIN breaker box panel
- Visualising a Raspberry Pi Kubernetes cluster by deploying the k8s web interface
- Longhorn for persistant, replicated storage on raspberry pi kubernetes cluster
- Deploying monitoring TIG stack (Telegraf, InfluxDB and Grafana) on Raspberry Pi Kubernetes cluster
- Deploying a NodeJS Postgres application to a Kubernetes Raspberry Pi Cluster
- Manage SSL certificates and ingress for services in k3s kubernetes cluster using cert-manager, letsencrypt and traefik