- Published on
Using influxdb, grafana and nodejs datalogger rasplogger to visualise solar panel data
- Authors

- Name
- Peter Peerdeman
- @peterpeerdeman
I've been working on a datalogging project collecting timeseries data using nodejs app RaspLogger to log the data, influxdb as a timeseries database and grafana to visualise the data. I will do a more elaborate writeup on this setup soon, but can already share a specific pvoutput based dashboard with some instructions!
I've formatted the guide in the form of the influx-db community templates:
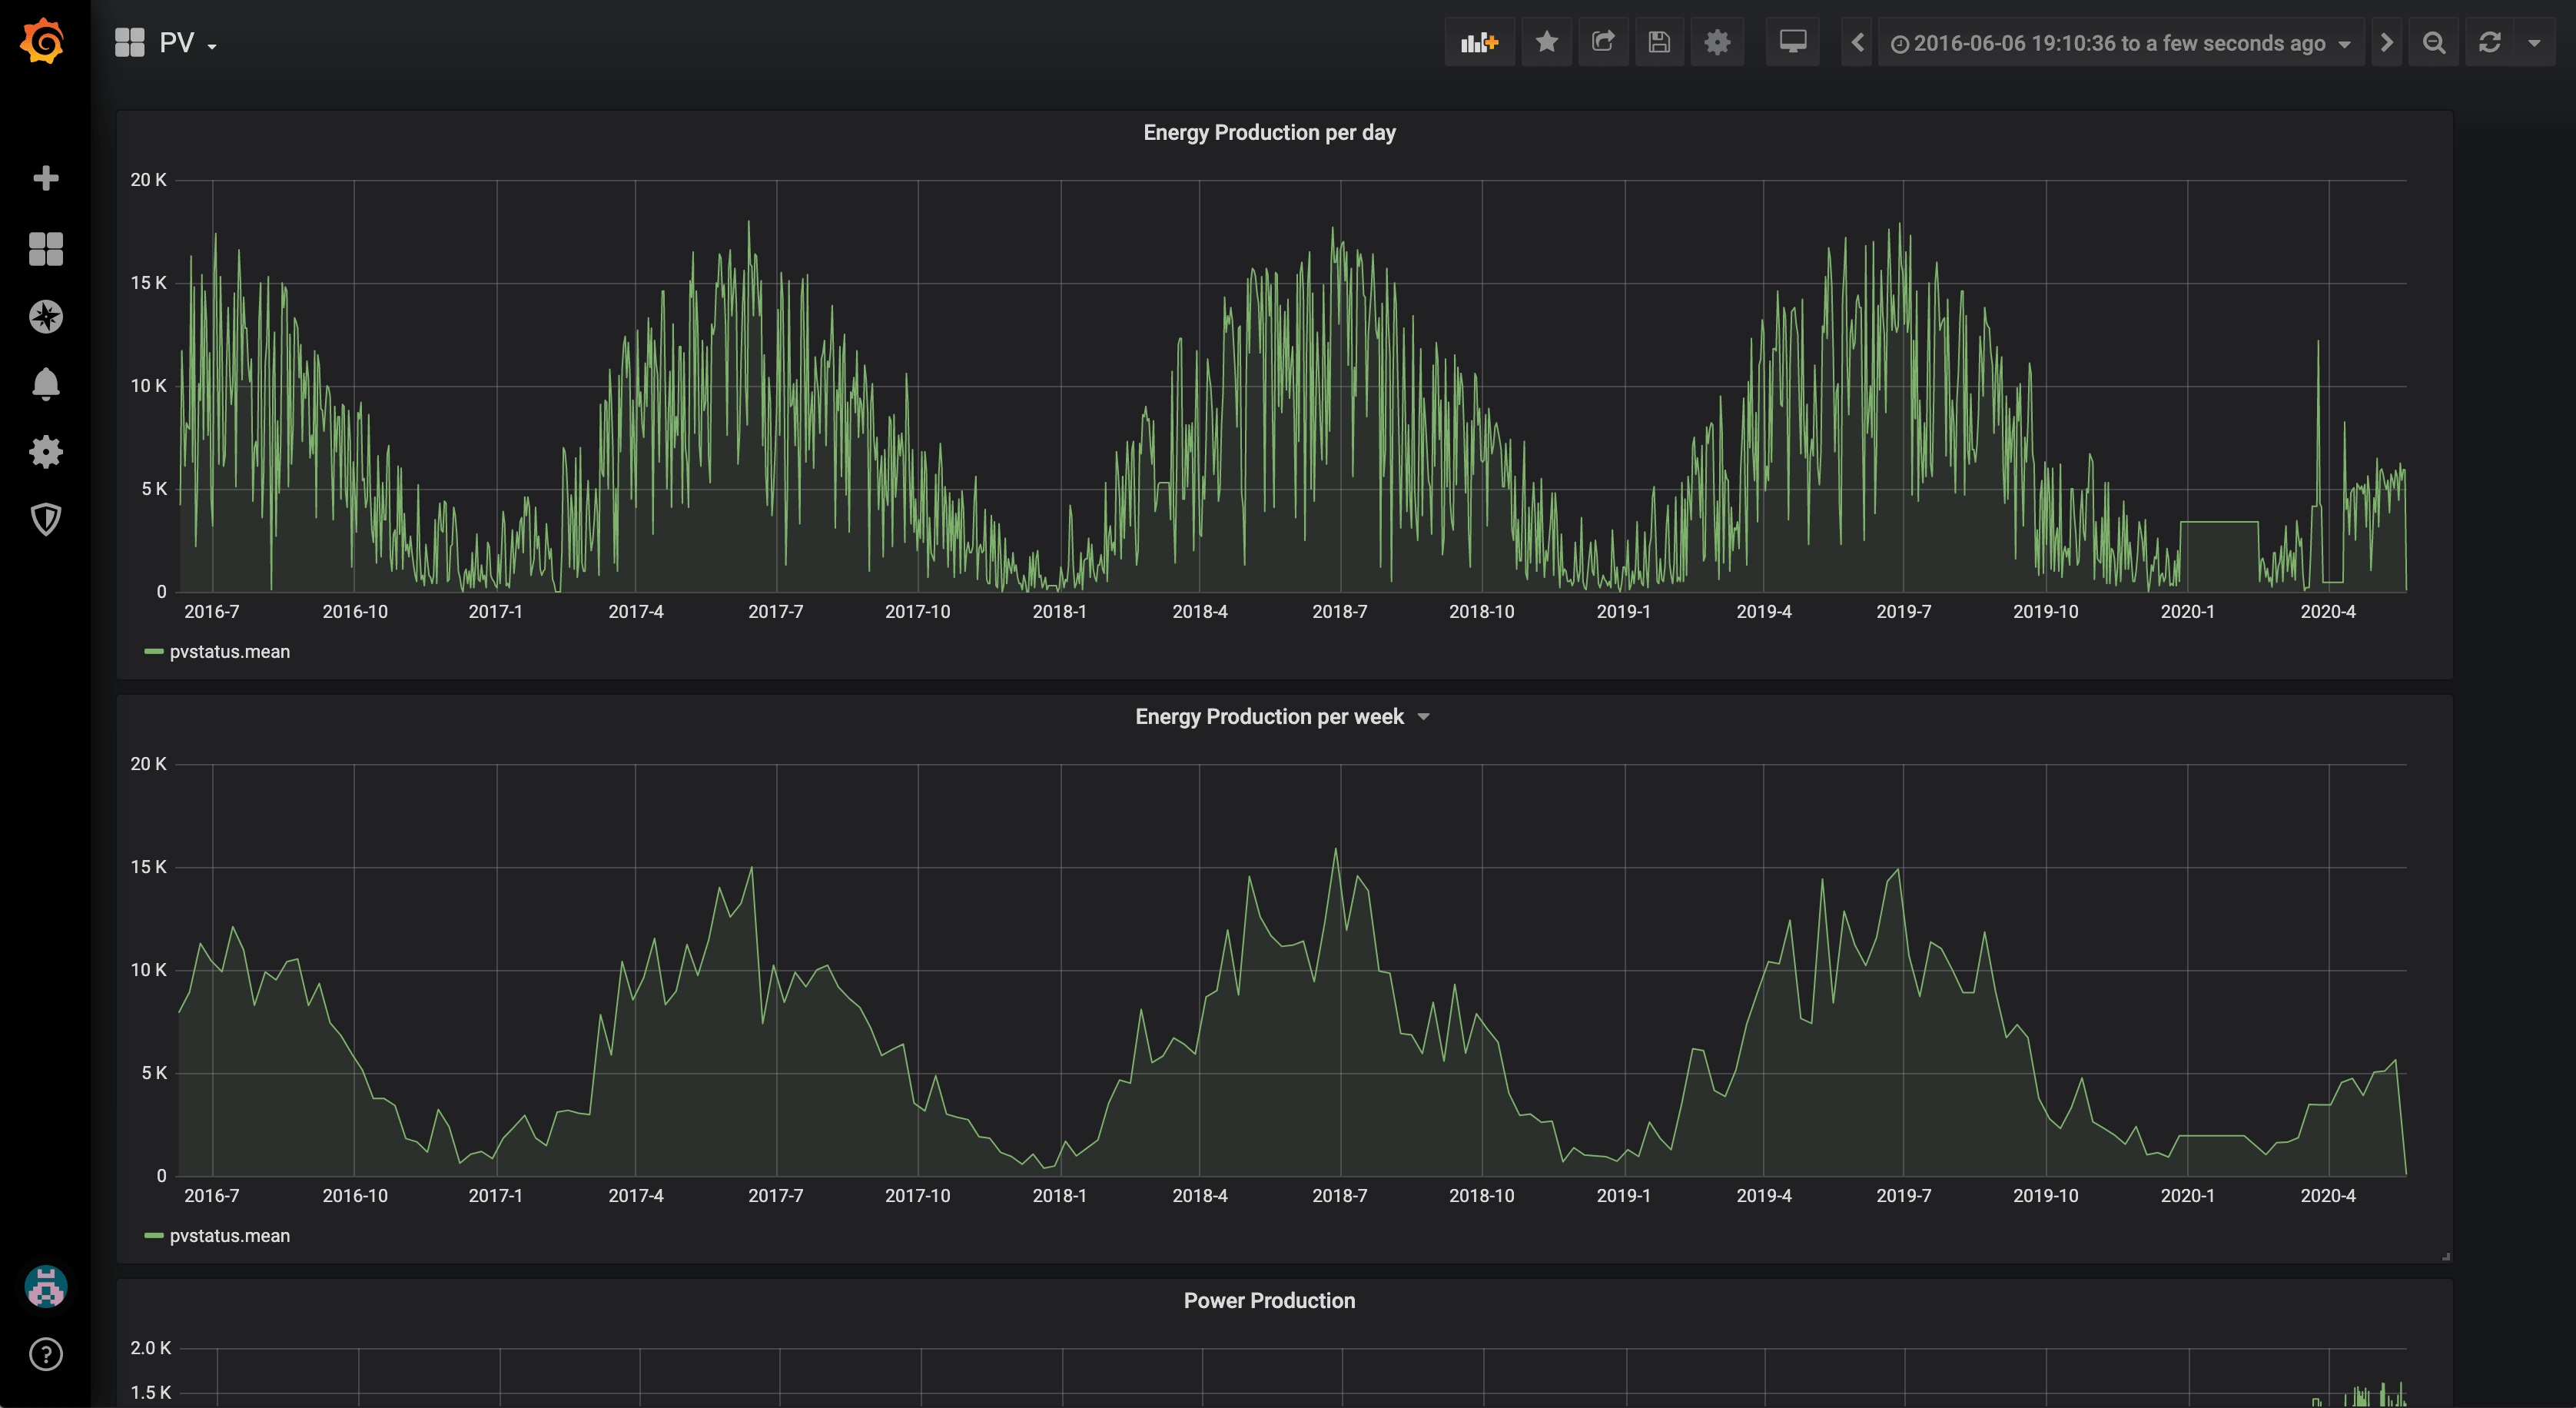
This dashboard shows solar panel data that is collected through a nodejs datalogger capturing data from pvoutput.org
Included Resources
1 PV Output dashboard json export for Grafana 6.7.3
Data collection with RaspLogger (pv module)
RaspLogger PV module requires the following environment variables
PVOUTPUT_APIKEY- The API key acquired at pvoutput.org websitePVOUTPUT_SYSTEMID- The PV system id you want the logger to capture
Continuously monitor pvoutput data by using RaspLogger to log data
git checkout git@github.com:peterpeerdeman/rasplogger.gitcd rasploggerdocker run -it --rm --name rasplogger_pv -v "$PWD":/usr/src/app -w /usr/src/app --restart always node:13-buster node rasplogger.js cron pv "*/5 * * * *" -u http://influxdb:8086/pv
migrating data / example data
If you want to import historical data from a pv installation, or experiment with some sample pv data you can use pvoutput-to-influx on github
next steps
If you are interesting in this topic, check out the next blogs about timeseries and predictions series here: