- Published on
Using Darts-Timeseries-Forecaster to perform configurable forecasting on timeseries
- Authors

- Name
- Peter Peerdeman
- @peterpeerdeman
In my previous blog about timeseries forecasting I made my first timeseries predictions facebook prophet. Since then I discovered the Darts library, an excellent suite of prediction models, including the prophet prediction model amongst others. As I've got a whole range of different time series data that I would like to create predictions for, I wanted to create a generic image that is capable of predicting various types of timeseries data, and easily configure them through environment variables, instead of creating separate python code projects for each of these predictions.
This is where darts-timeseries-forecaster comes in, implementing a number of models and runs as a container configurable through environment variables. Let's first look on the data flow I have in mind for this project:
- Use Grafana ui to explore and visualise the timeseries data
- Extract the timeseries data to a CSV file
- Use darts-timeseries-forecaster to create the predictions
- Send the prediction data back to influxdb
- Visualise the predictions in grafana
Let's start by exploring the timeseries we want to predict on. We use the Grafana ui to visualise influxdb data we have collected want to forecast, for example some parking places data I've been collecting over time. To retrieve the CSV data from this panel, we click the triple dots on the top right of the panel, inspect, data and then press the download CSV button to download the csv file.
We can now run the darts-timeseries-forecaster docker image. The image takes care of reading the CSV file, preparing the data to play nice with the python datastructures and read your configuration before fitting the darts models. We configure the container to use the current working directory with the parking.csv file as input, format the output as influx line format, the output file predictions.txt output text file and a couple of values that are specific to the timeseries, such as the time between each datapoint and the number of values to include in the moving average to smooth out the input values:
docker run  --rm -v $PWD:/volume \
-e INPUT_MOVINGAVERAGE=30 \
-e INPUT_FREQUENCY=10min \
-e OUTPUT_FORMAT=influx \
-e OUTPUT_FILENAME=/volume/prediction.txt \
-e INPUT_FILENAME=/volume/parking.csv \
-it peterpeerdeman/darts-timeseries-forecaster:1.0.6 python app.py
This should result in a prediction.txt file in the current directory, containing a (configurable!) number of predictions in influx line format.
$ cat prediction.txt
parkingplace-prediction value=83.12296946120426 1722943800000000000
parkingplace-prediction value=78.65139429588925 1722944400000000000
parkingplace-prediction value=74.74646037831982 1722945000000000000
parkingplace-prediction value=71.50597696133534 1722945600000000000
parkingplace-prediction value=68.9932880523818 1722946200000000000
parkingplace-prediction value=67.23355505362935 1722946800000000000
...
We can now use curl to post these prediction lines back to the influxdb server:
curl -i -XPOST 'http://192.168.x.x:8086/write?db=parking' --data-binary @prediction.txt
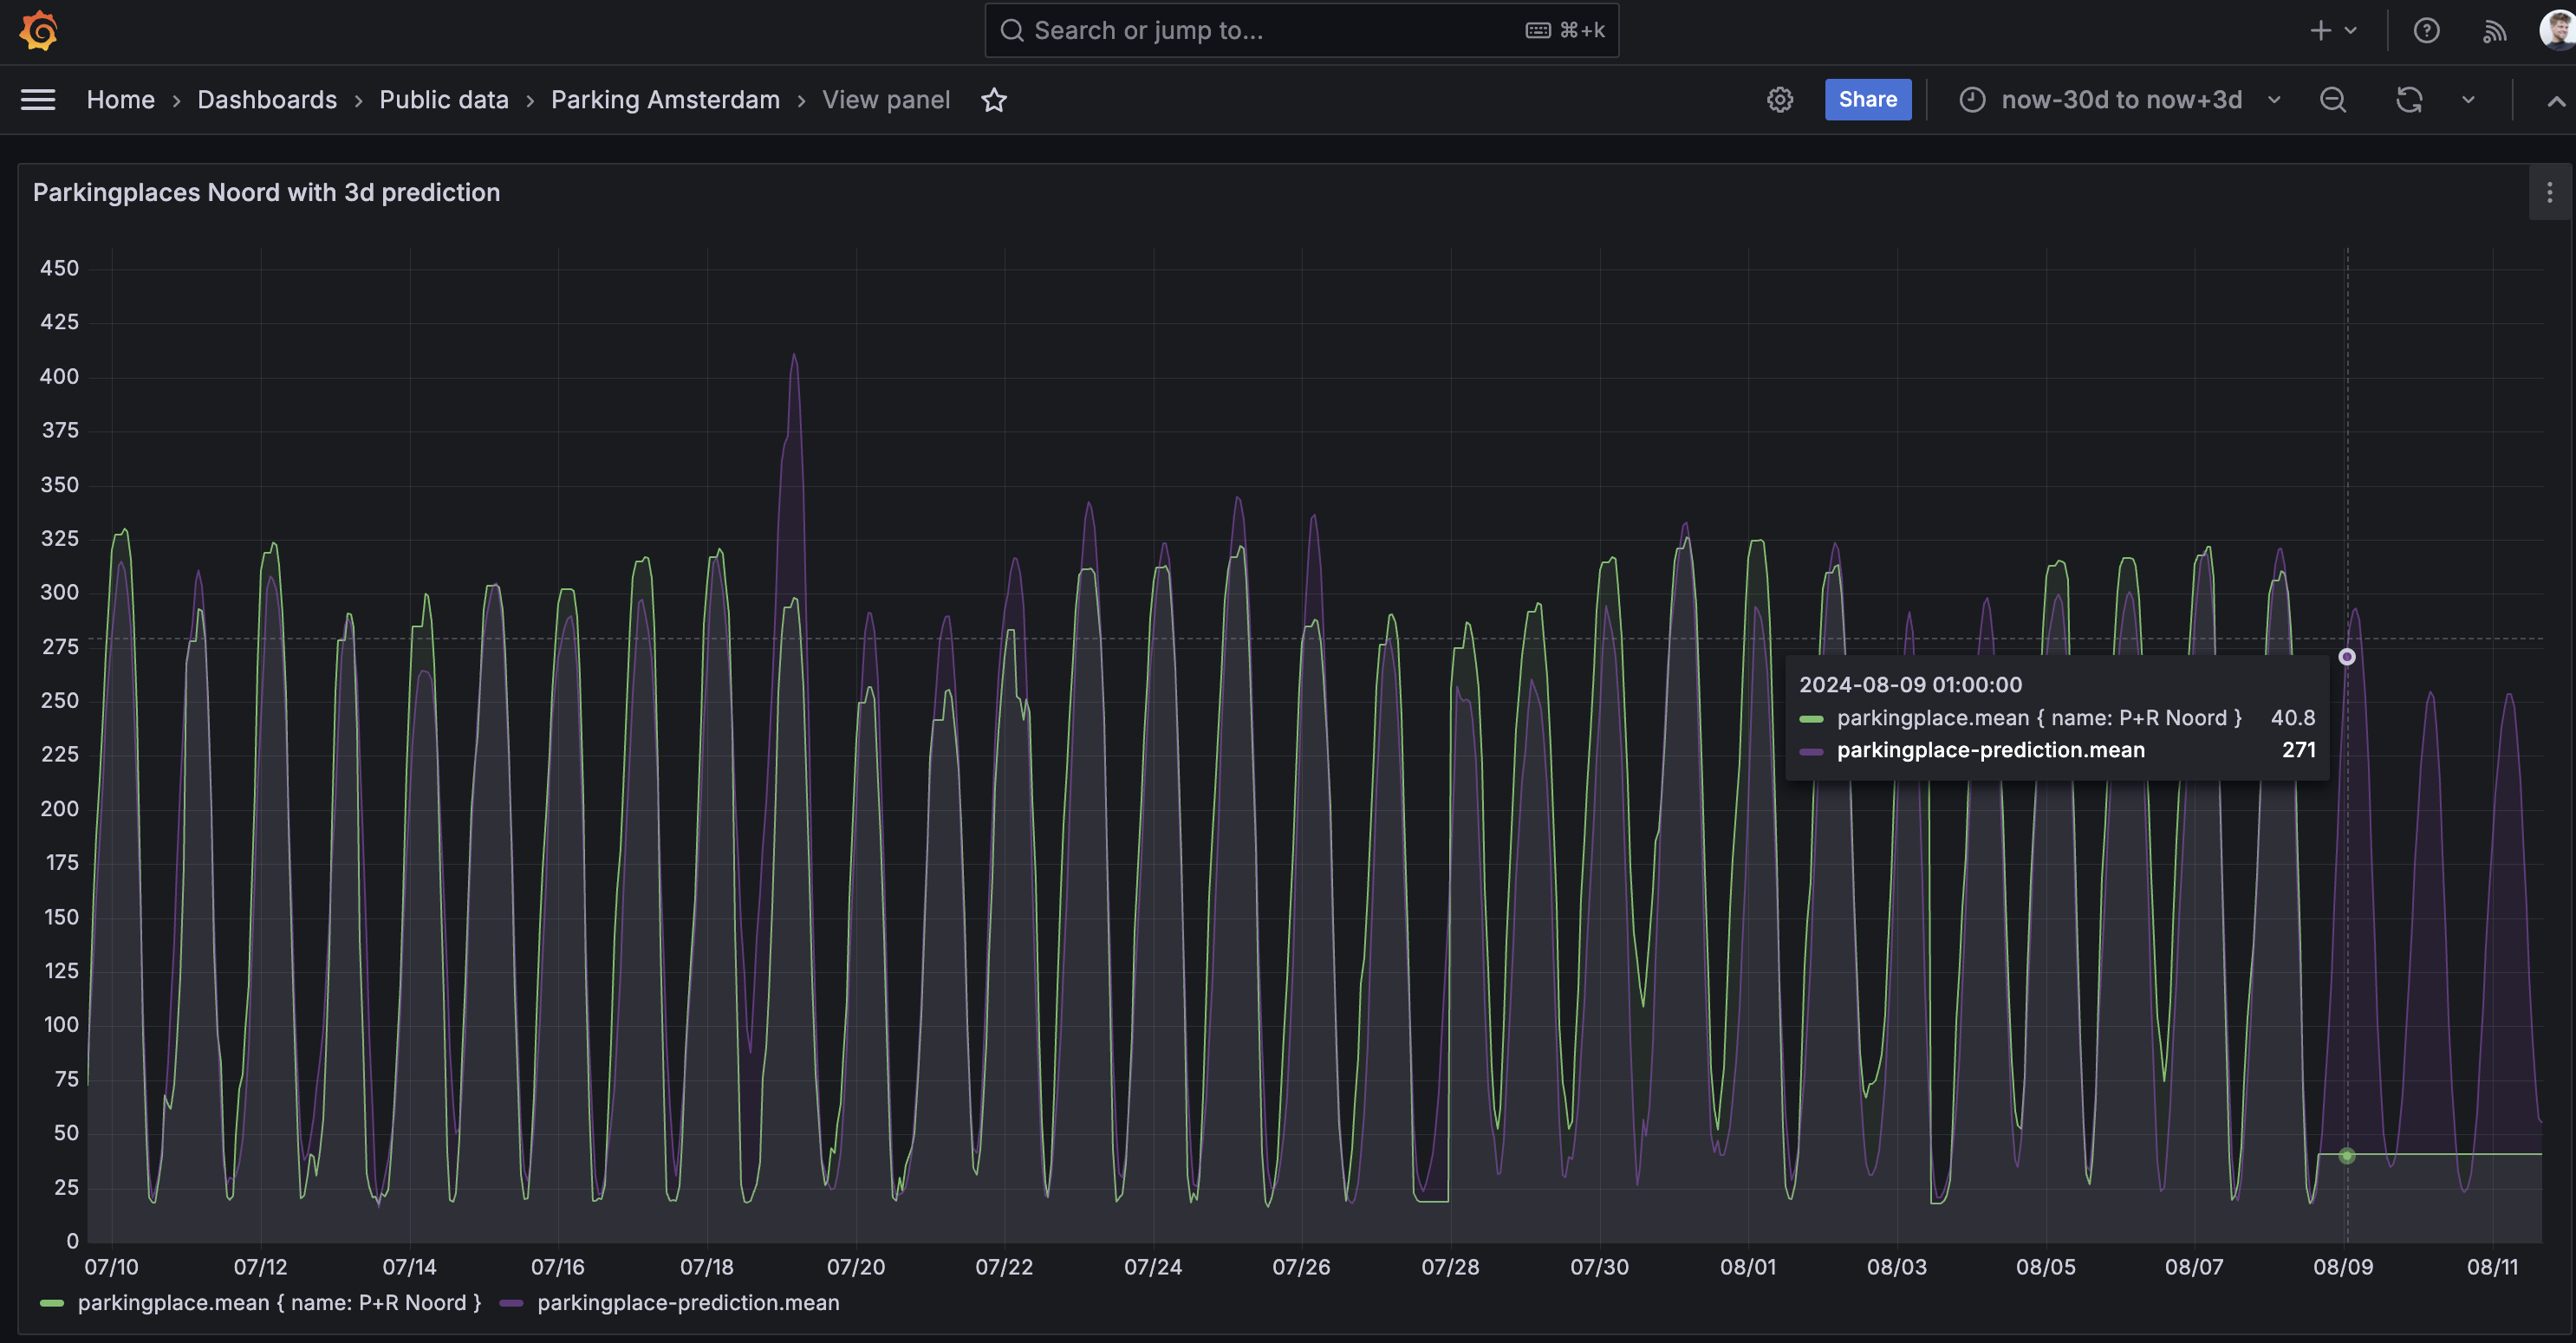
All thats left is visualising the prediction. If we return to Grafana, we can duplicate the query that we initially used to display the csv file, change the metric name to the *-prediction shown in the predictions.txt file and use the time range selector to show a number of values in the future:
The darts-timeseries-forecaster docker image supports a couple of different models that you can try out to create a suitable forecast:
- fft: fast fourier translation, a simple and fast sine wave based on recurring patterns
- autoarima: an autoregressive integrated moving average, also quite fast compared to nbeats
- nbeats: leverages backcasting and forecasting techniques, much heavier and requires multiple epochs of computation
Now we have gotten this flow to work once, we should be able to implement it into an automated, recurring workflow. This would allow us to continuously view a near-realtime updated prediction in our Grafana ui. Read how I implemented that automated workflow using Argo Workflow here.
If you are just tuning in, check the full timeseries and forecasting blogseries here: