- Published on
Collecting and observing Kubernetes pod logs using Loki, Alloy and Grafana
- Authors

- Name
- Peter Peerdeman
- @peterpeerdeman
For log aggregation and log visualisation, I worked with the ELK stack before. I didn't implement this in all of my projects because it is quite a heavy setup. Especially elasticsearch is quite a resource intensive java process. For most of the applications I've worked on it was a lot easier to just use a SaaS solution like papertrail.
Recently, I got wind of Loki, which is a completely new product from Grafana. It offers a lightweight log storage setup with go-based codebase that scales out each of its components separately if needed. As a plus for fanboys like me, it integrates very nicely into grafana dashboards and which can result in very powerful aggregated log and metric dashboards.
In this case, I just want to have one place where all of the logs from my [k8s cluster] pods are aggregated, and allow me to create some simple metrics, log details and alerting when specific loglines occur. Let's start by installing Loki into our cluster. We'll keep it simple with the monolithic install, follow the instructions for modifying the yaml file as instructed in the docs here
helm repo add grafana https://grafana.github.io/helm-charts
helm repo update
helm install --values values.yaml loki grafana/loki
Now that loki is running, we can continue with Alloy, formerly known as grafana-agent, which is a small process that will run on each of our cluster nodes. Grafana released a convenient helm chart called k8s-monitoring that is able to monitor a whole bunch of things, amongst which functionality to gather logs from all the pods in your cluster. Lets start by downloading the values.yaml file and doing some minor customisations.
We start by specifying the kubernetes cluster's name, enable alloy-logs, and configure loki as the destination to ship the logs to. Make sure it is a full url including transport and port name:
cluster:
  name: my-k8s-cluster-name

alloy-logs:
  enabled: true

podLogs:
  enabled: true
  destinations:
    - loki

destinations:
  - name: loki
    type: loki
    url: http://loki:3100/loki/api/v1/push
Feel free to change any values, check the docs for more information about configuring things. For now, install the chart, fire up your k9s console and watch those agent pods get spawned!
helm install alloy-k8s-monitoring --atomic --timeout 300s grafana/k8s-monitoring -n monitoring --values values.yaml
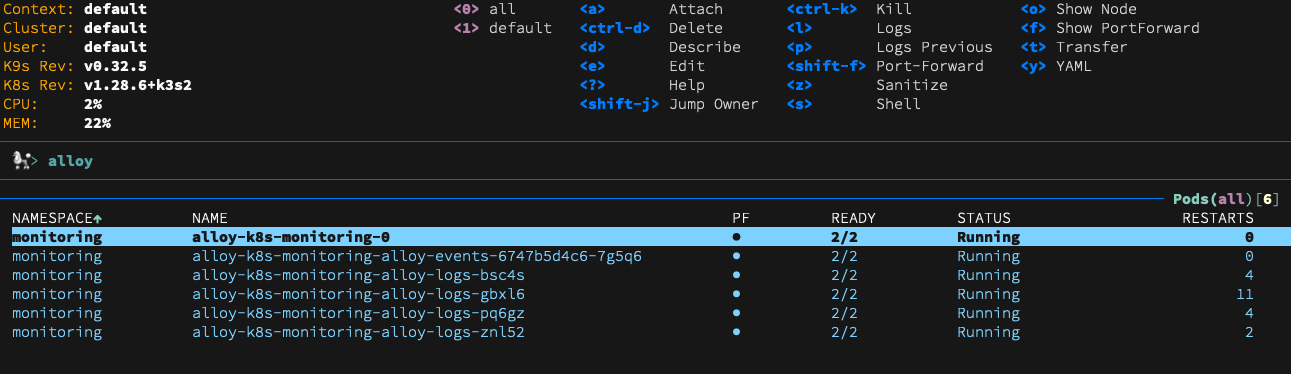
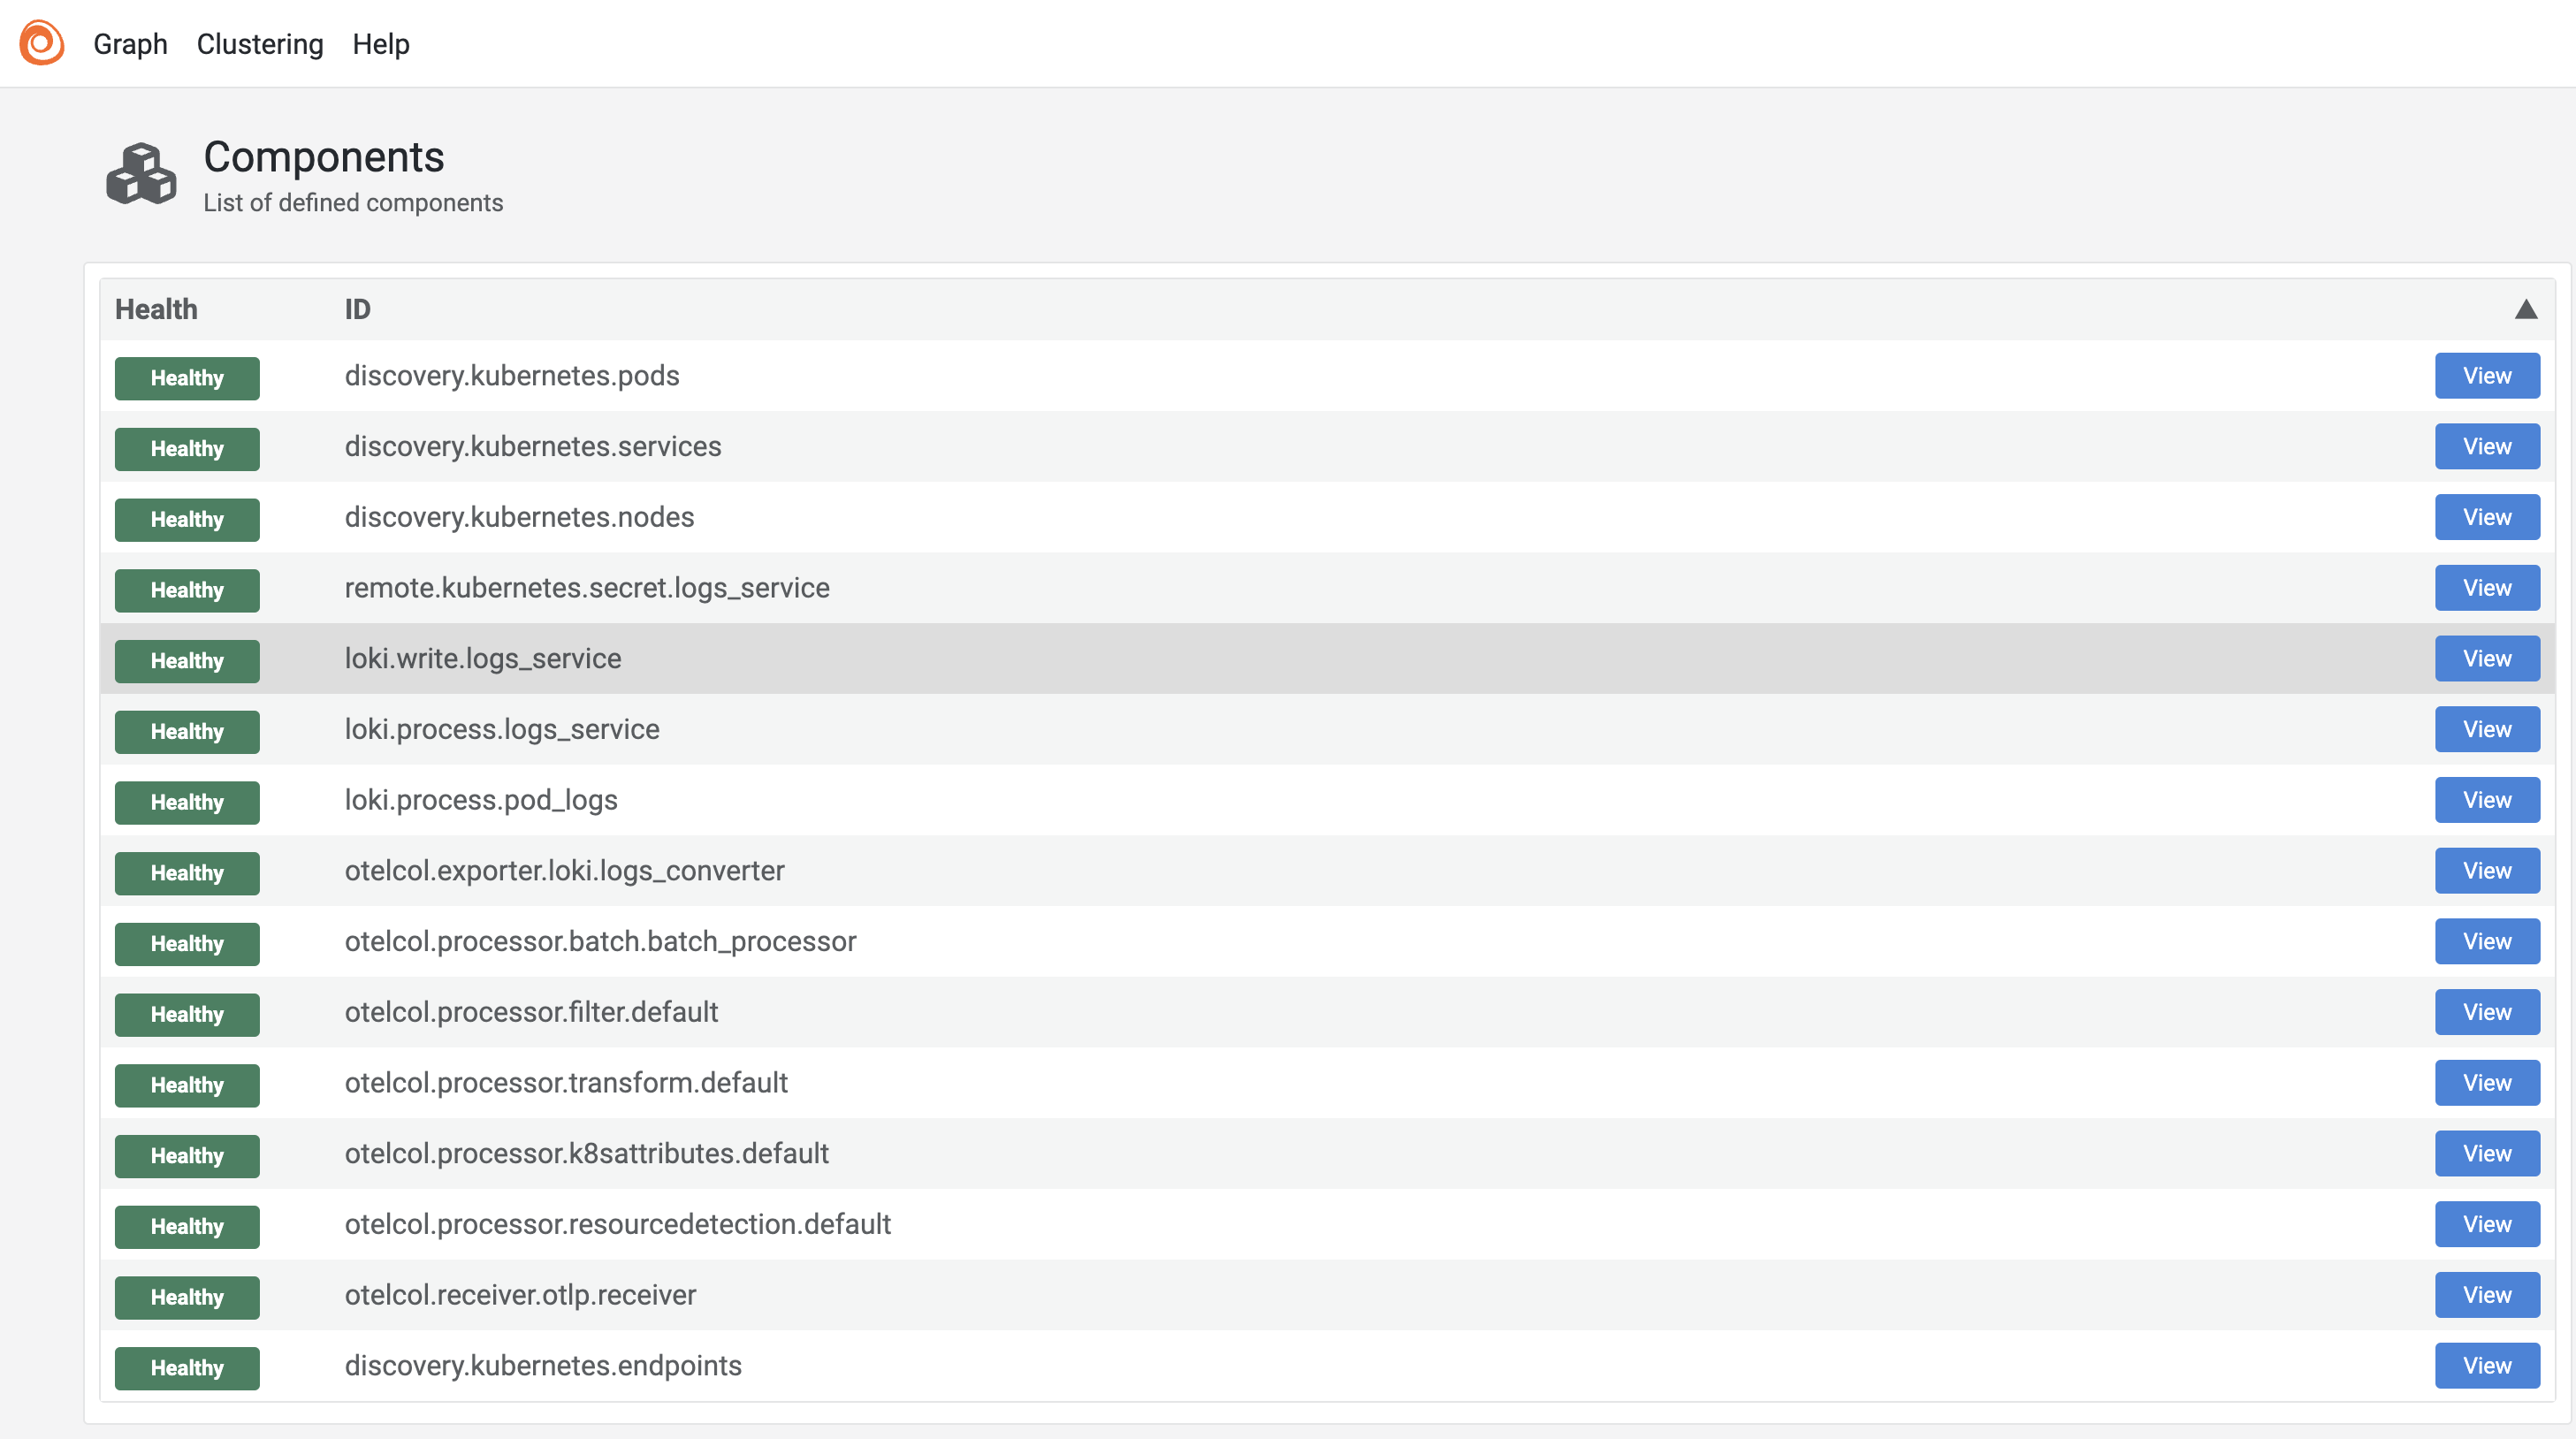
K9s shows us 6 running pods: four logging pods that run on all my 4 k8s nodes, one alloy pod that exports kubernetes events on the control plane and one main alloy pod alloy pod that collects the logs from each of the nodes. If we create a port forward on the main alloy pod (using shift+f in the k9s console), we can take a peek at the Alloy user interface, showing us a long list of Alloy components. Each component has arguments (settings) and an export of values that are exposed to other components:
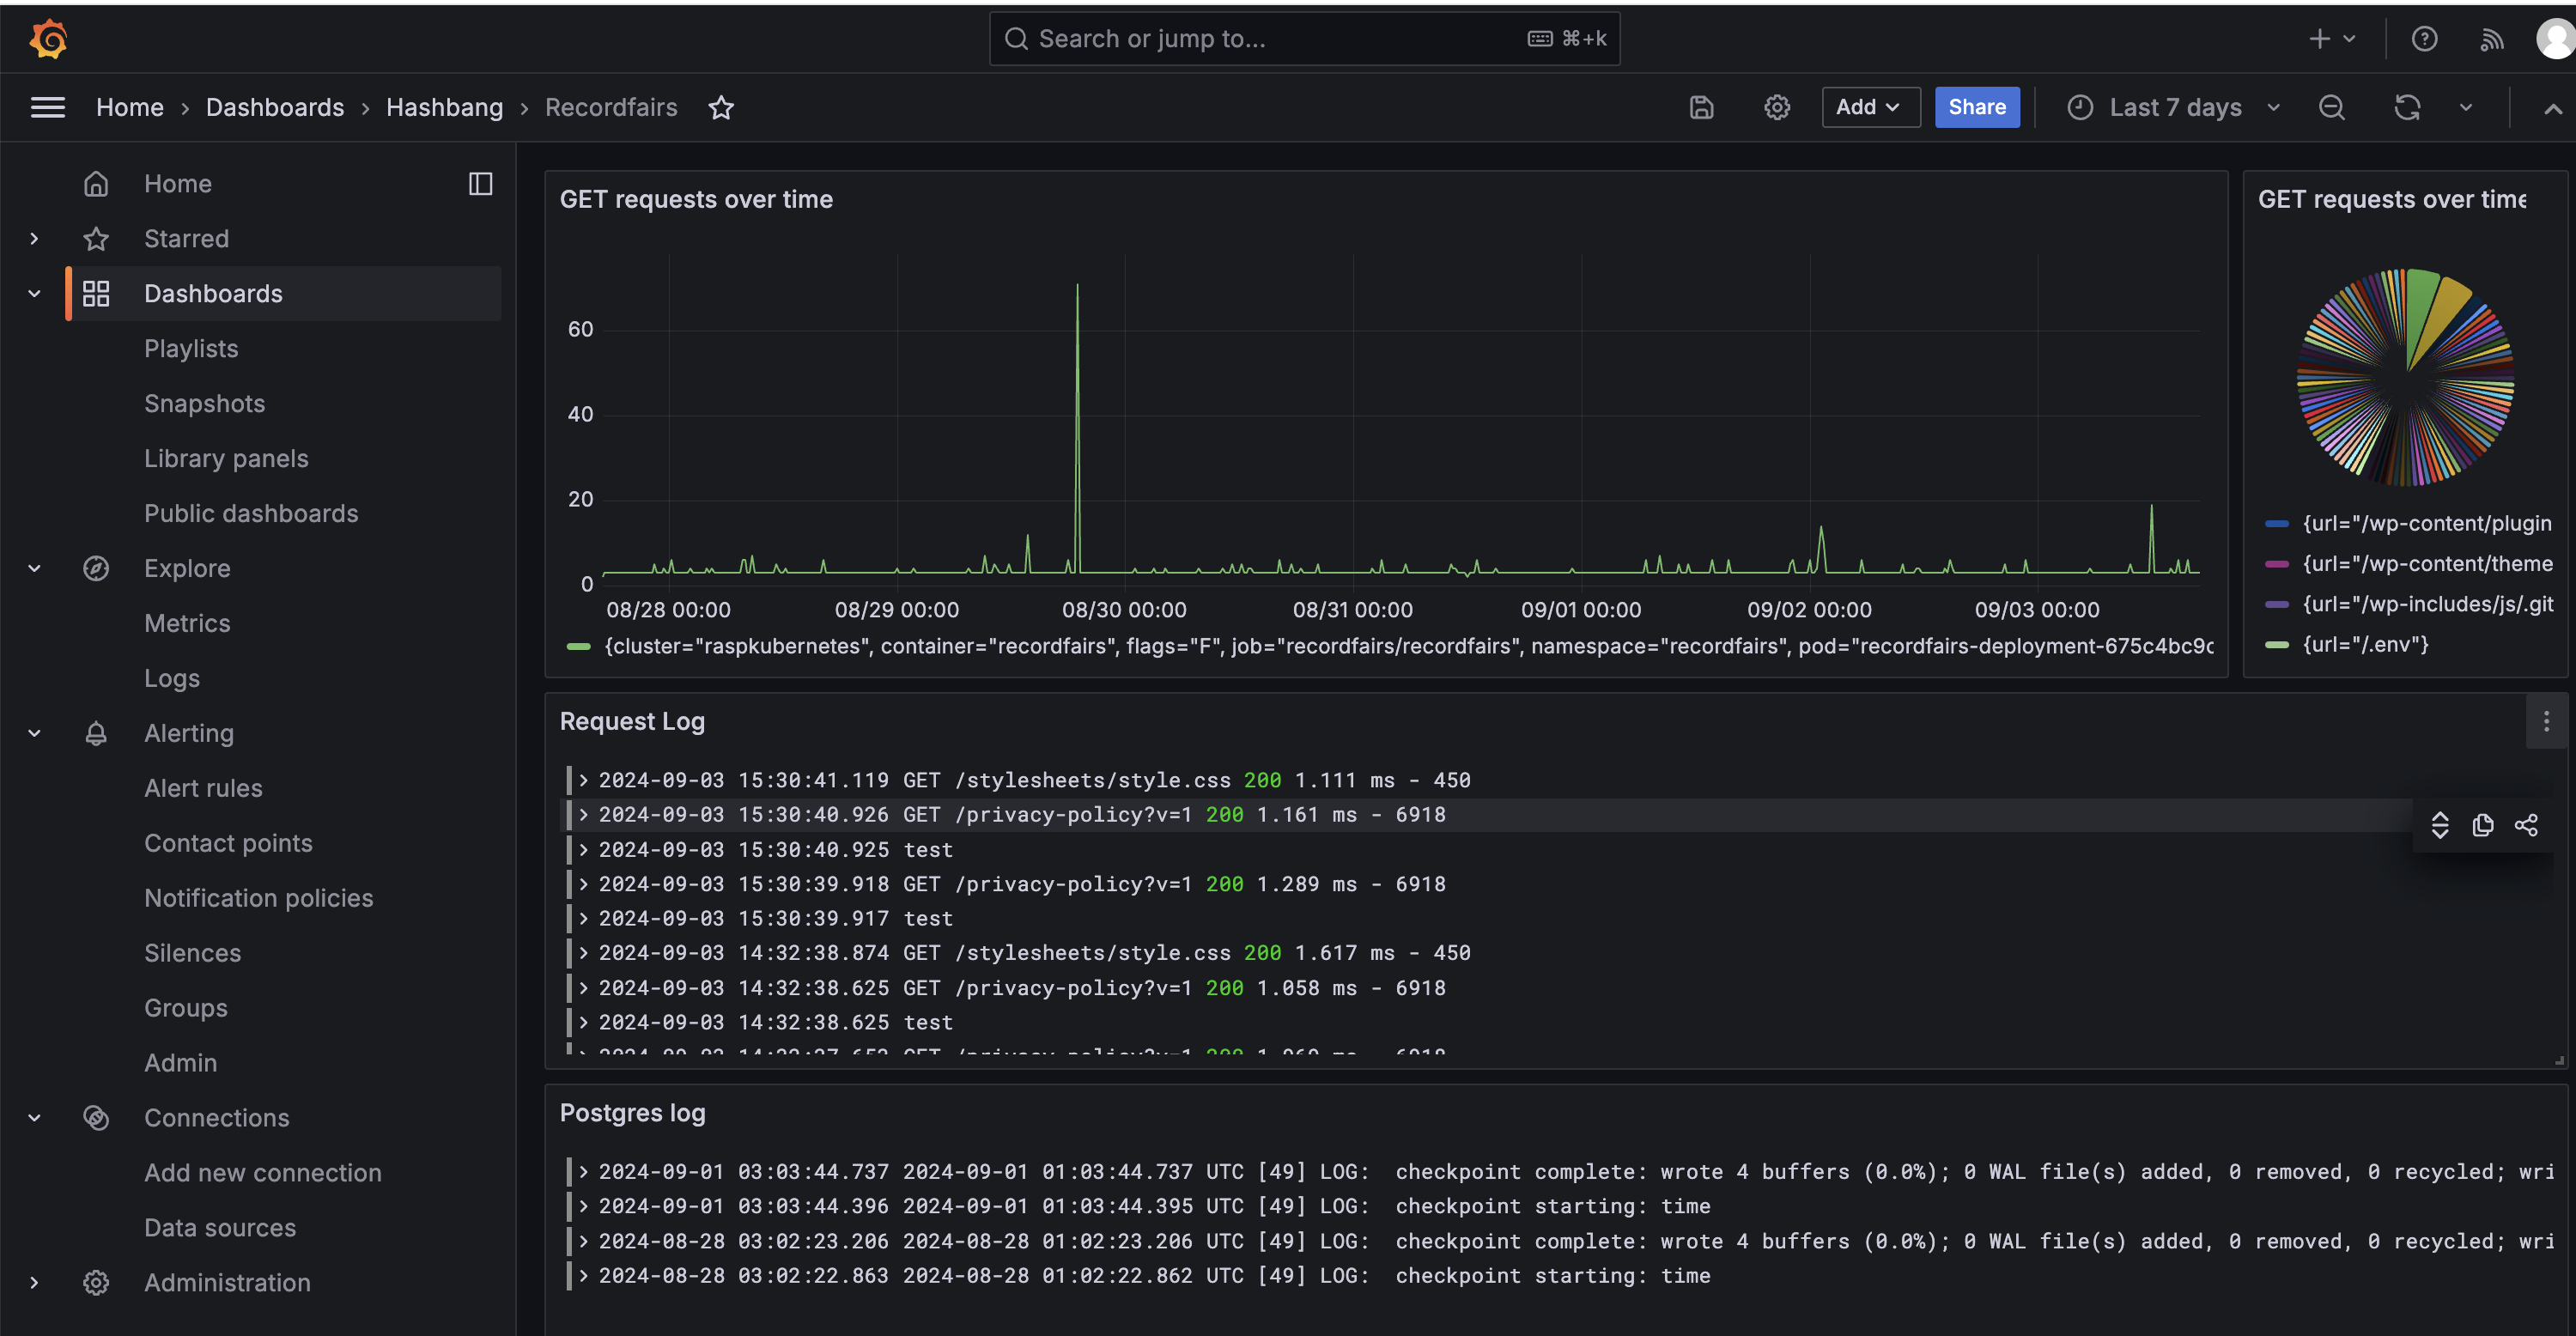
Logs should now be flowing into Loki. If we fire up Grafana we can now create a dashboard, add loki as a datasource and show logs from multiple services and metrics calculated from our logs all in the same dashboard. For instance, my dashboard for Recordfairs shows logs from the application pod, logs from the postgres pod and shows the number of GET requests plotted over time in the top graph:
update: Thank you siegy22 for updating the blog to the latest version of alloy in July 2025!
I dive in a little deeper how to create these kind of aggregated metrics dashboards in the blog "Aggregated intrusion detection dashboarding of PFSense metrics and Snort alert logs with Grafana, telegraf, Influx and Loki"