- Published on
Installing, exposing and monitoring a UPS for Raspberry Pi with Network Ups Tools (NUT), Influxdb and Grafana
- Authors

- Name
- Peter Peerdeman
- @peterpeerdeman
To protect my Raspberry Pi server against sudden power outage and power fluctuations I've decided to install an "Uninterruptable Power Supply", or "UPS". I got the APC Back-UPS 2200VA, 230V, AVR, 4 Schuko outlets that gives my raspberry pi a window of about 1 hour to properly shut down without damaging the hardware or losing data.
Serving the UPS API
It looks like UPS systems have been around for quite a while, and not a whole lot has happened in that space as the software to monitor these devices is quite arcane. I finally settled on nutupsd to expose the UPS statistics, using the following docker-compose config:
version: '3.3'
services:
    nutupsd:
        container_name: nutupsd
        image: instantlinux/nut-upsd:2.7.4-r8
        restart: always
        environment:
            SERIAL: ${UPS_1_SERIAL}
        ports:
            - '3493:3493/tcp'
        secrets:
            - nut-upsd-password
        privileged: true
Trying out the UPS API
We now have a server application running on port 3493 that exposes the UPS statistics detected through the USB cable coming from the UPS. Back in the day, there was no REST, no JSON and not even XML or SOAP. You can test the API only with netcat, connecting to the port directly and sending ASCII commands such as LIST UPS and LIST VAR <upsname> to retrieve the data:
» nc 127.0.0.1 3493
LIST UPS

BEGIN LIST UPS
UPS ups "UPS"
END LIST UPS

LIST VAR ups

BEGIN LIST VAR ups
VAR ups battery.charge "100"
VAR ups battery.charge.low "1"
VAR ups battery.mfr.date "2001/01/01"
VAR ups battery.runtime "3816"
VAR ups battery.runtime.low "120"
VAR ups battery.type "PbAc"
VAR ups battery.voltage "27.2"
VAR ups battery.voltage.nominal "24.0"
VAR ups device.mfr "American Power Conversion"
VAR ups device.model "Back-UPS BX2200MI"
...
VAR ups ups.status "OL"
...
Exporting the UPS data to influxdb
To get a more visual look at the UPS status I've used nut-influxdb-exporter to export these details to influxdb, using the following docker-compose config:
version: '3.3'
services:
    nutlogger:
        container_name: nutlogger
        image: peterpeerdeman/nut-influxdb-exporter:1.0.0
        restart: always
        environment:
            INFLUXDB_DATABASE: nutups
            INFLUXDB_HOST: influxdb
            NUT_HOST: nutupsd
            NUT_PORT: 3493
        depends_on:
            - influxdb
    influxdb:
        ports:
            - '8086:8086'
        volumes:
            - ~/influxdb/data:/var/lib/influxdb/data
            - ~/influxdb/meta:/var/lib/influxdb/meta
            - ~/influxdb/wal:/var/lib/influxdb/wal
            - ~/influxdb/config:/var/etc/influxdb
        restart: always
        container_name: influxdb
        image: influxdb:1.8.10
    grafana:
        ports:
            - '3001:3000'
        volumes:
            - ~/grafana/data:/var/lib/grafana
        environment:
        restart: always
        container_name: grafana
        image: grafana/grafana:8.4.5
        depends_on:
            - influxdb
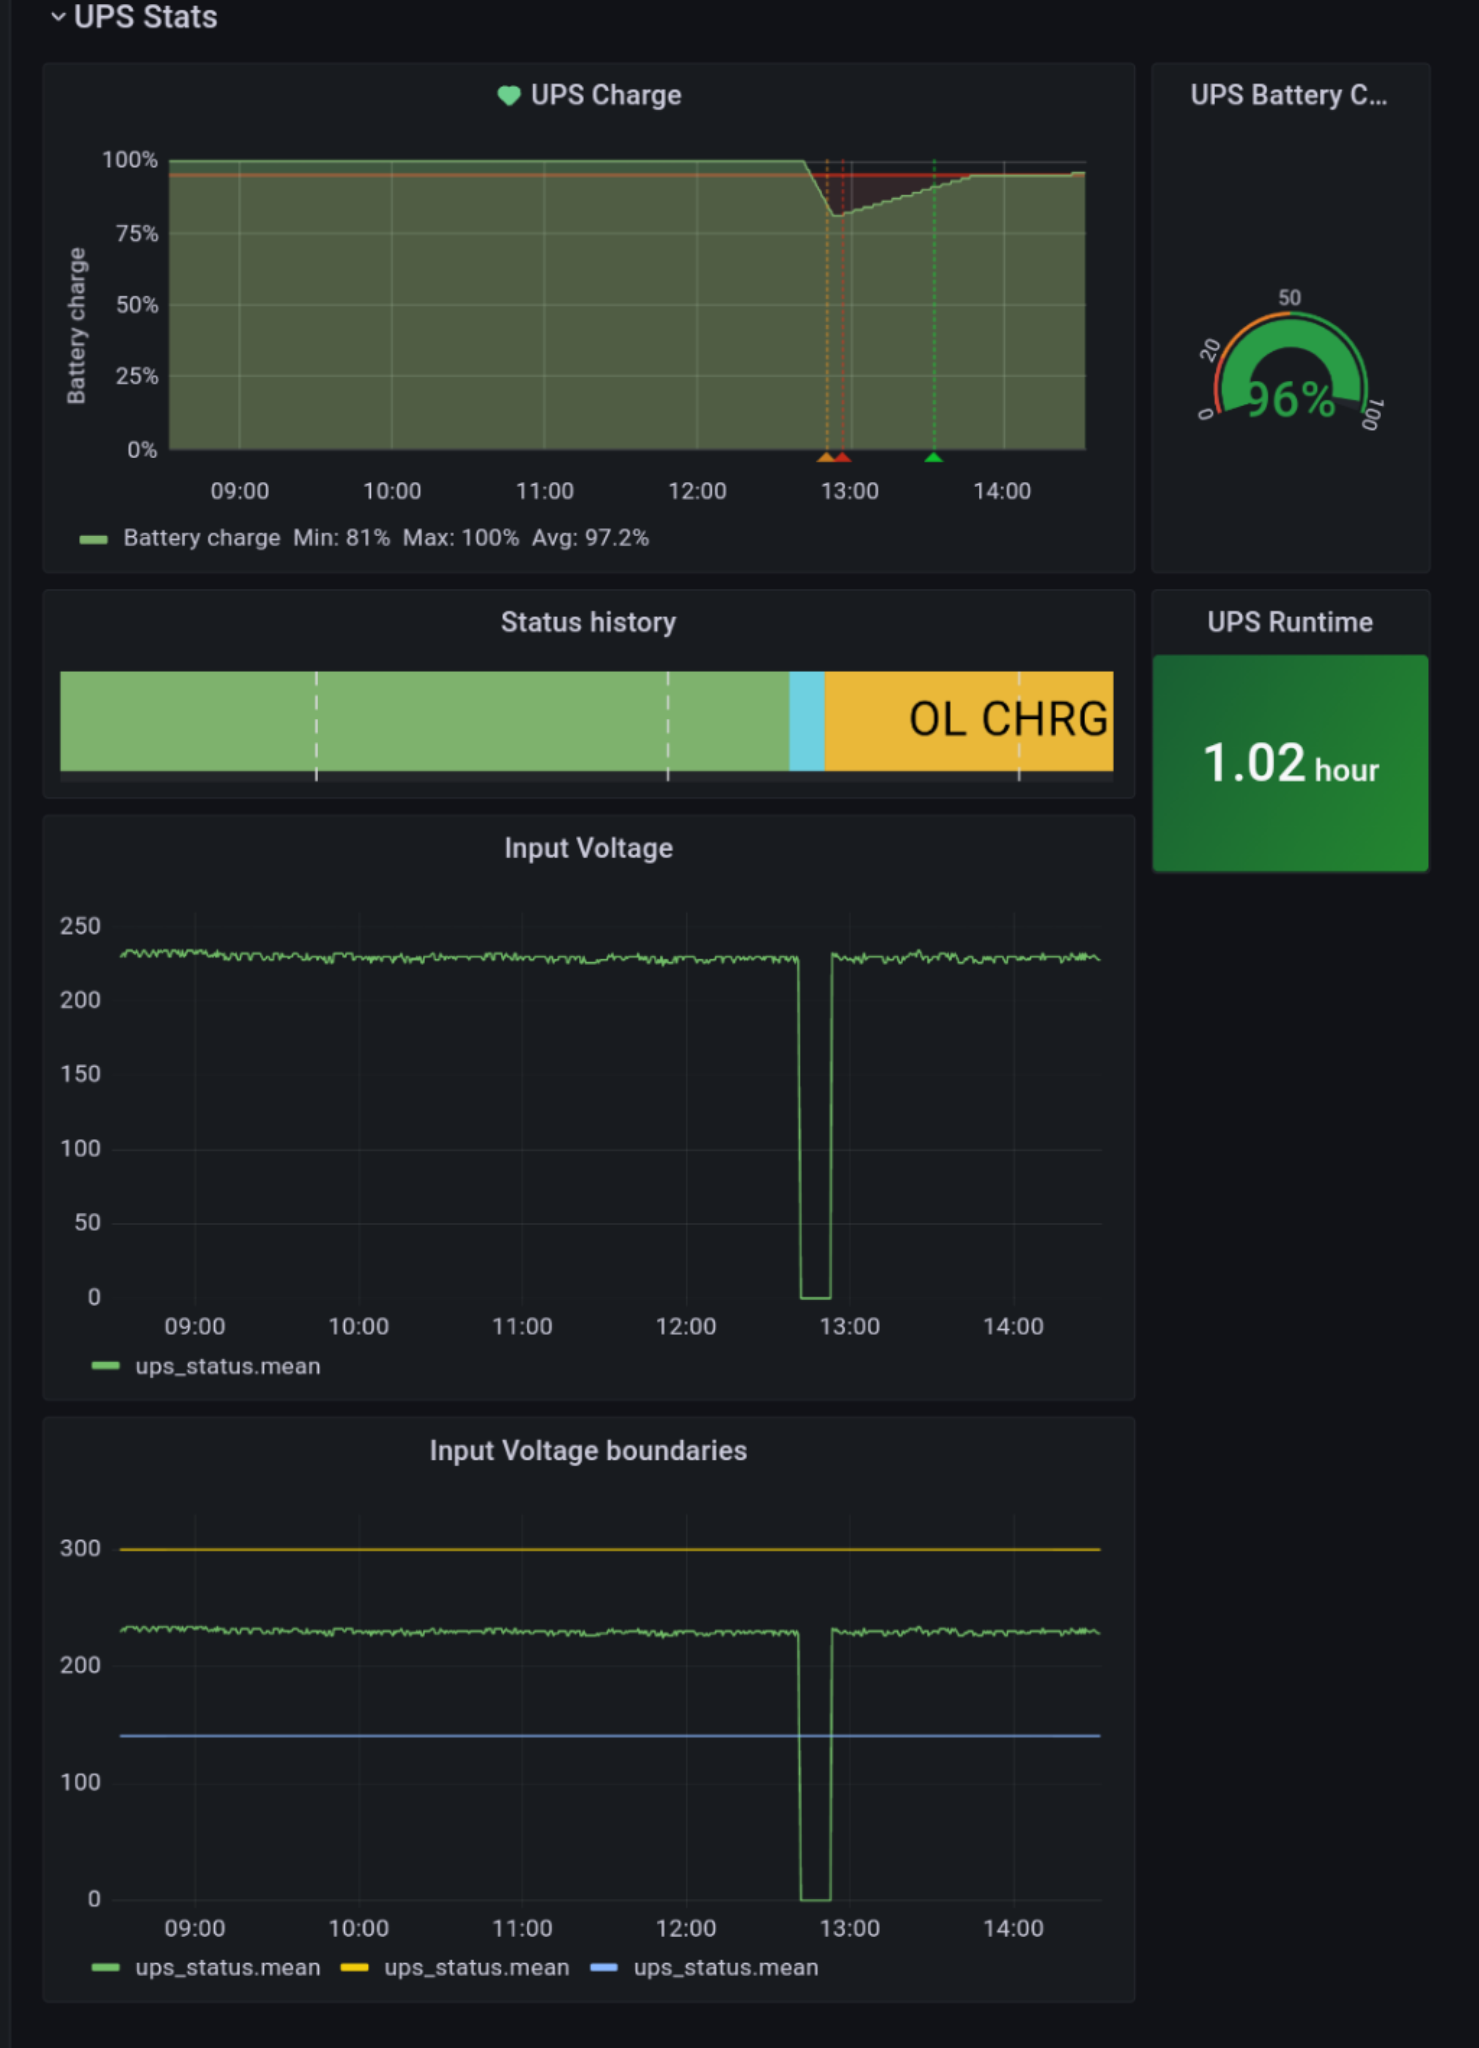
Visualising a power outage
Nutlogger now extracts the information from nutupsd every 10 seconds and feeds this as a datapoint to influxdb. We can now visualise the timeseries in grafana by plotting the data over time. Below is an image of the system in action, where the power went out for a short duration. You can see the input voltage dropping to 0, the UPS charge declining sharply, the status history turning to "discharging" (in blue). When the power went back on, the status turned to "online, charging" and the UPS charge slowly rising again.
My grafana dashboard is derived from the dashboard export by kiwimato, you can find that in the nut-influxdb-exporter repository here.
Alerting and shutting down
To keep up to date with the current status I set up some grafana alerts to send emails when power goes out, and when the battery is low. This allows me to do a manual shutdown or wait out the power outage. In addition to the visual monitoring, I've setup upsmon on some of the servers that I want to automatically shut down when the UPS battery levels are low.
I've installed these services with apt-get, by following this guide by Mike R. The only difference is when setting the MONITOR line using the IP-address of the server that is running the nutupsd daemon instead of the localhost.
Testing
Wrapping up, it is of course wise to test the system for proper working. I ran sudo tail -f /var/log/syslog on the server that is monitoring the UPS, briefly pulled the plug on the UPS and could see that it immediately recognized the outage:
Apr 20 18:23:17 raspberrypi systemd[1]: Started Network UPS Tools - power device monitor and shutdown controller.
Apr 20 18:31:57 raspberrypi upsmon[10060]: UPS UPS@192.168.x.x on battery

Broadcast message from nut@raspberrypi (somewhere) (Wed Apr 20 18:31:57 2022):

UPS UPS@192.168.x.x on battery

Apr 20 18:33:02 raspberrypi upsmon[10060]: UPS UPS@192.168.x.x on line power

Broadcast message from nut@raspberrypi (somewhere) (Wed Apr 20 18:33:02 2022):

UPS UPS@192.168.x.x on line power
To do a full shutdown test, You could of course pull the plug on the UPS, let the battery die down and see if the nut clients that are connected will actually shut down by then, but it is also possible to simulate a critical power level and send an immediate shutdown to all devices listening to the upsmon. To do this, I went into the nutupsd docker container and ran the upsmon shutdown command there:
$ docker exec -it nutupsd /bin/sh
/ # upsmon -c fsd
On the server that was monitoring the UPS, we now see a message that a forced shutdown is in progress, and after a couple of seconds starts shutting down the system gracefully, as expected!
Apr 20 19:39:23 raspberrypi upsmon[10060]: UPS UPS@192.168.x.x: forced shutdown in progress

Broadcast message from nut@raspberrypi (somewhere) (Wed Apr 20 19:39:23 2022):

UPS UPS@192.168.x.x: forced shutdown in progress

Apr 20 19:39:39 raspberrypi upsmon[10060]: Host sync timer expired, forcing shutdown
Apr 20 19:39:39 raspberrypi upsmon[10060]: Executing automatic power-fail shutdown

Broadcast message from nut@raspberrypi (somewhere) (Wed Apr 20 19:39:39 2022):

Executing automatic power-fail shutdown


Apr 20 19:39:39 raspberrypi upsmon[10060]: Auto logout and shutdown proceeding

Broadcast message from nut@raspberrypi (somewhere) (Wed Apr 20 19:39:39 2022):

Auto logout and shutdown proceeding

Apr 20 19:39:44 raspberrypi systemd[1]: nut-monitor.service: Succeeded.
Apr 20 19:39:44 raspberrypi systemd[1]: unattended-upgrades.service: Succe