- Published on
Turning a markdown notes archive into business insights using influxdb and grafana
- Authors

- Name
- Peter Peerdeman
- @peterpeerdeman
As the compulsively organised notetaker I am, I've been maintaining an archive of a notes taken during business meetings for a long while, ensuring consistently structured filenames to describe the date, relation name and subject:
20210422-lifely-interview-jane.md
20210423-alpha-voorstel-voorbereiding.md
20210426-beta.md
20210426-gamma-interview-joe.md
20210428-delta-handover.md
20210428-delta-intro-sander.md
20210428-lifely-review.md
20210428-lifely-upgradeable-technology-post-brainstorm.md
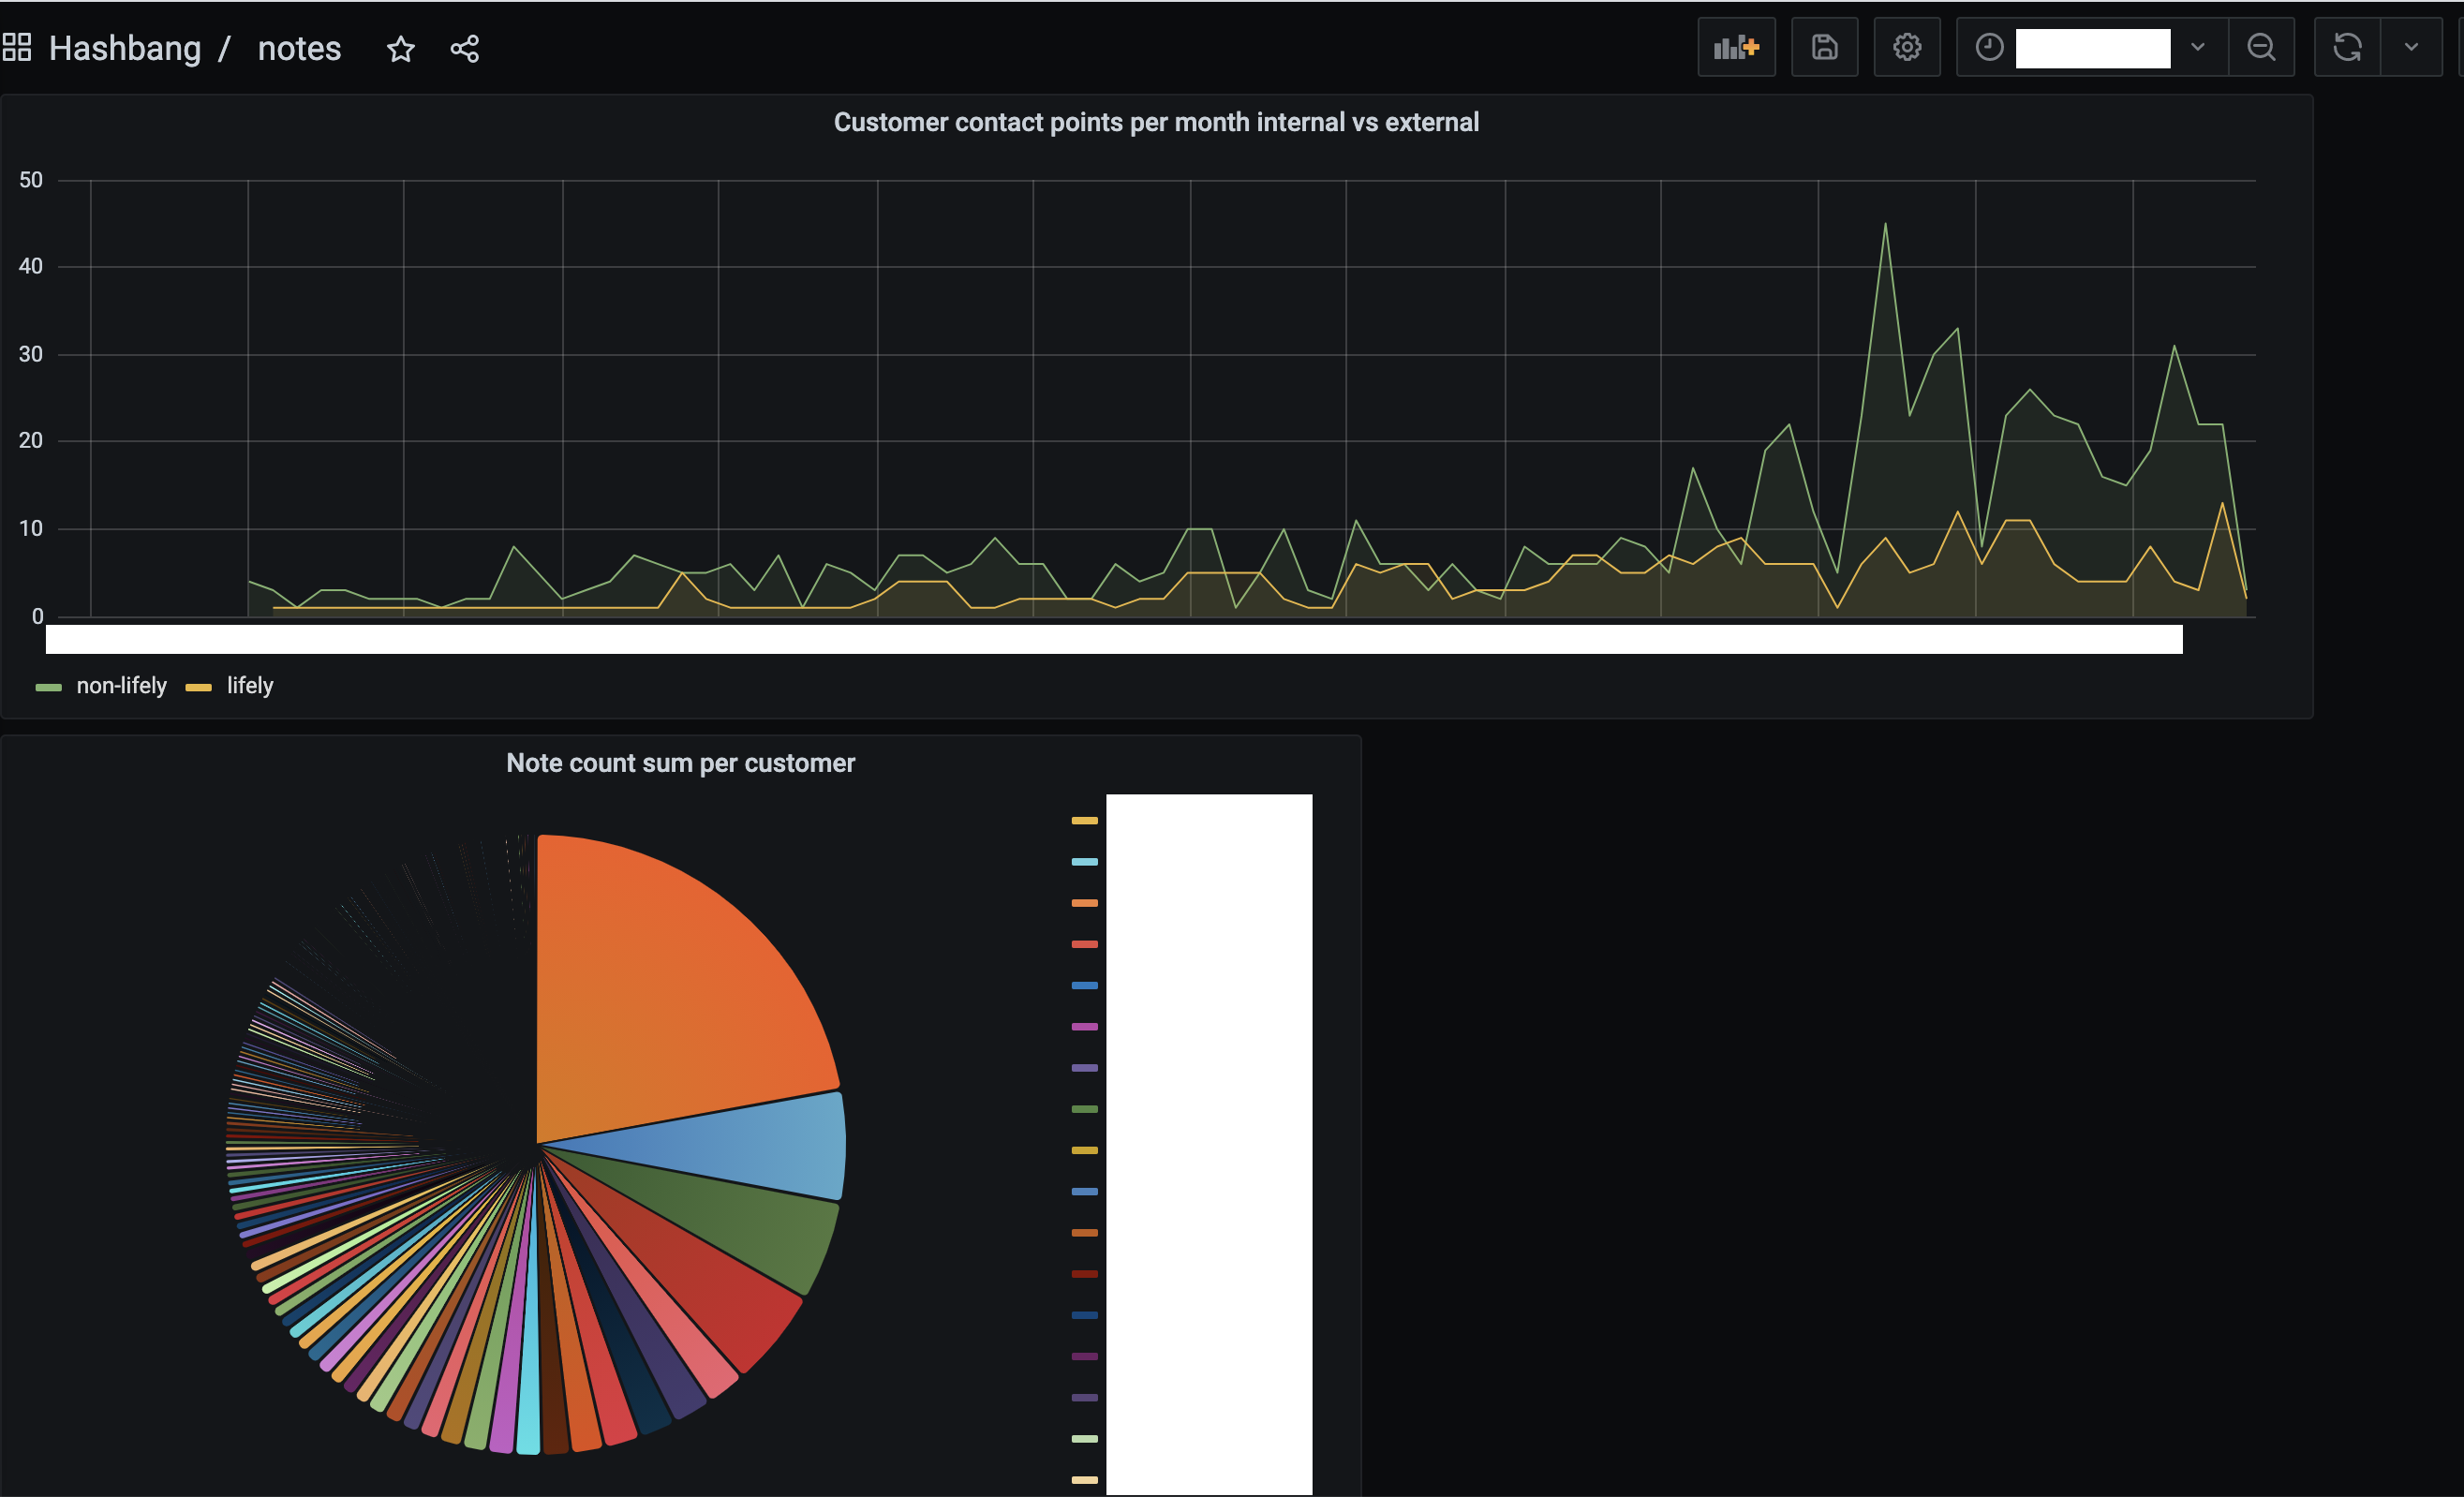
As I was working on some dashboards, I was wondering for which relations I made the most notes, and was curious to see how many meetings I had internally (e.g. labeled relation "lifely") or externally. I wrote a small data exporter using TypeScript to turn the directory listing into datapoints, feed these datapoints into influxdb and visualise the results using grafana.
I was quite pleased with the structure of the project, making a separation between the datapoint structure, the mocha tests and readme including details on getting influx and grafana running.
Interestingly, loads of small inferences can be made from graphs drawn from this limited metadata. They give insight into the amount of touchpoints with certain relations, trends in the amount activity in general and could even be combined with other data streams to compare results in relation to the amount of touch points.
You can view the full code in the "markdown-notes-to-influx-grafana-dashboard-insights" github repository