- Published on
Giving a local LLM access to my filesystem and e-reader database with MCP
- Authors

- Name
- Peter Peerdeman
- @peterpeerdeman
Last night we dove into LLMs, especially tool calling via the Model Context Protocol. Let's give the LLMs (both a local model and a frontier model) access to some real things on my machine, such as the filesystem, a SQLite database and see what they could actually do with them.
MCP standardises how an application exposes its functionality to a language model. Instead of every tool inventing its own integration, a model speaks one protocol and any MCP server can offer it a set of callable functions. Which means the interesting question stops being "what does the model know" and starts being "what do I let it touch".
I kept a small writeup on MCP in my notes as we went.
the local mcp setup
I ran a local instance of ollama with llama3.2, with two mcp servers wired up: a filesystem server pointed at a sandbox folder, and a SQLite server pointed at a copy of KoboReader.sqlite.
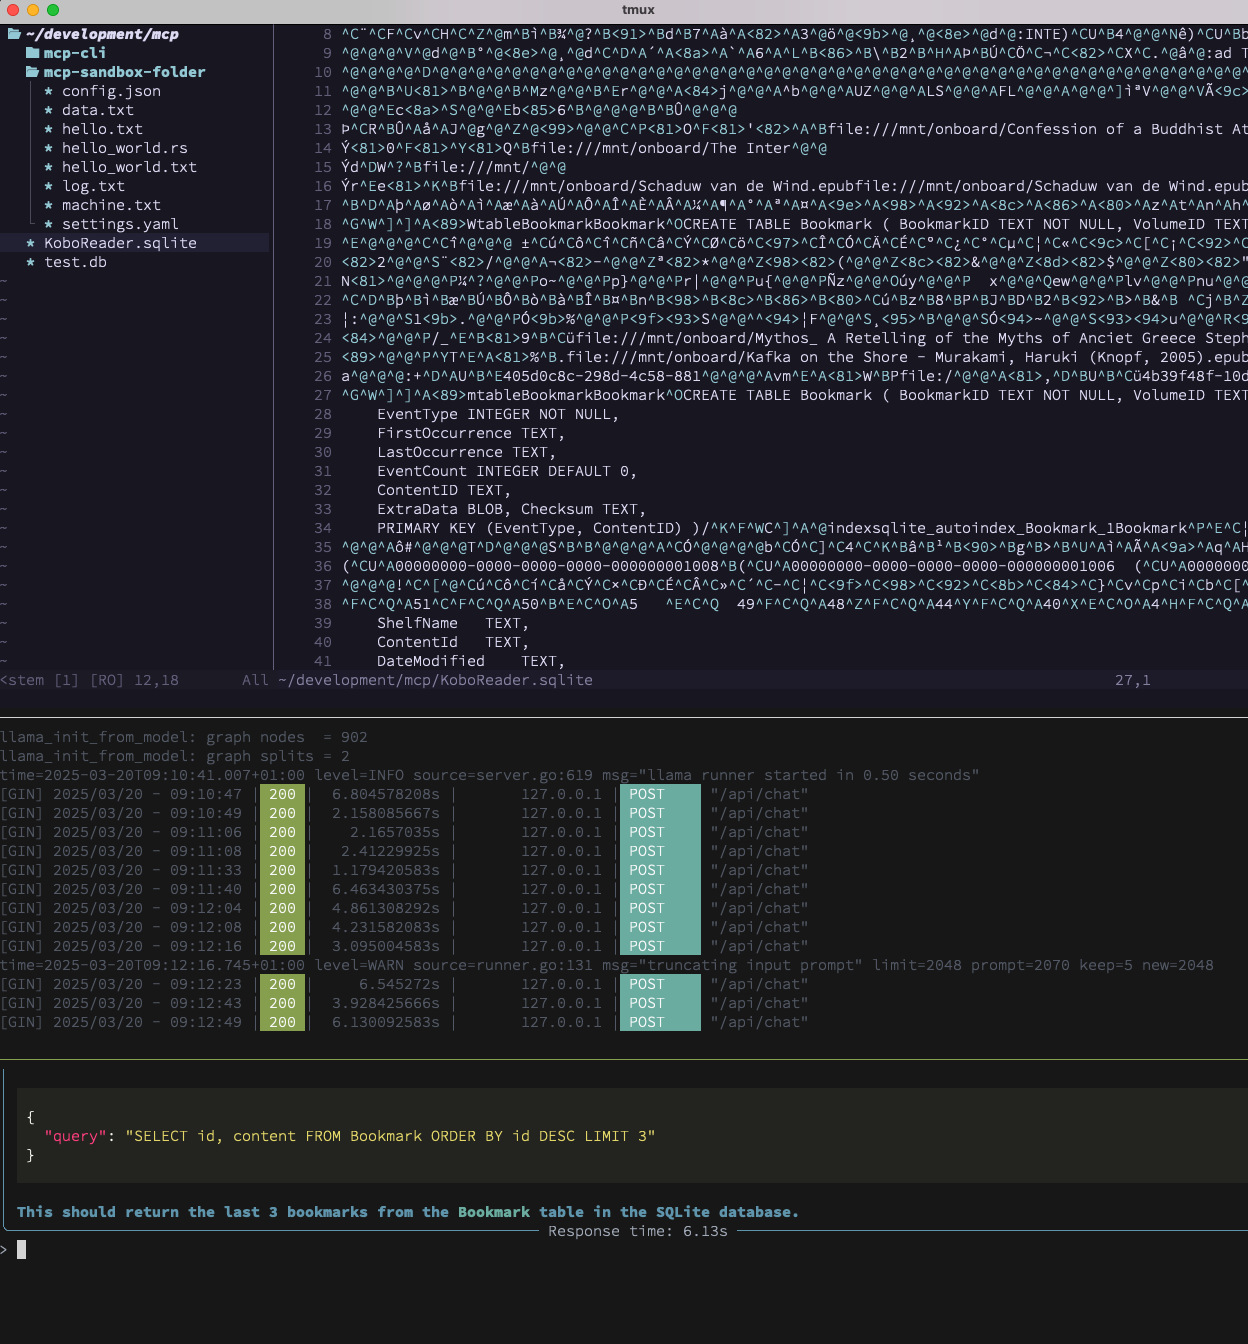
Given a question about the database, the model at least produced a tool call:
{
  "query": "SELECT id, content FROM Bookmark ORDER BY id DESC LIMIT 3"
}
"This should return the last 3 bookmarks from the Bookmark table in the SQLite database."
Which was correct, not prompted, generated entirely locally, but also not really that interesting.
using the latest claude 3.7
Switching the same MCP servers over to Claude 3.7 I asked it something I did not know the answer to, and deliberately did not tell it how to find out:
when was I most actively reading, based on the number of highlights?
Nothing in that question says where highlights live. The model had to figure this out for itself.
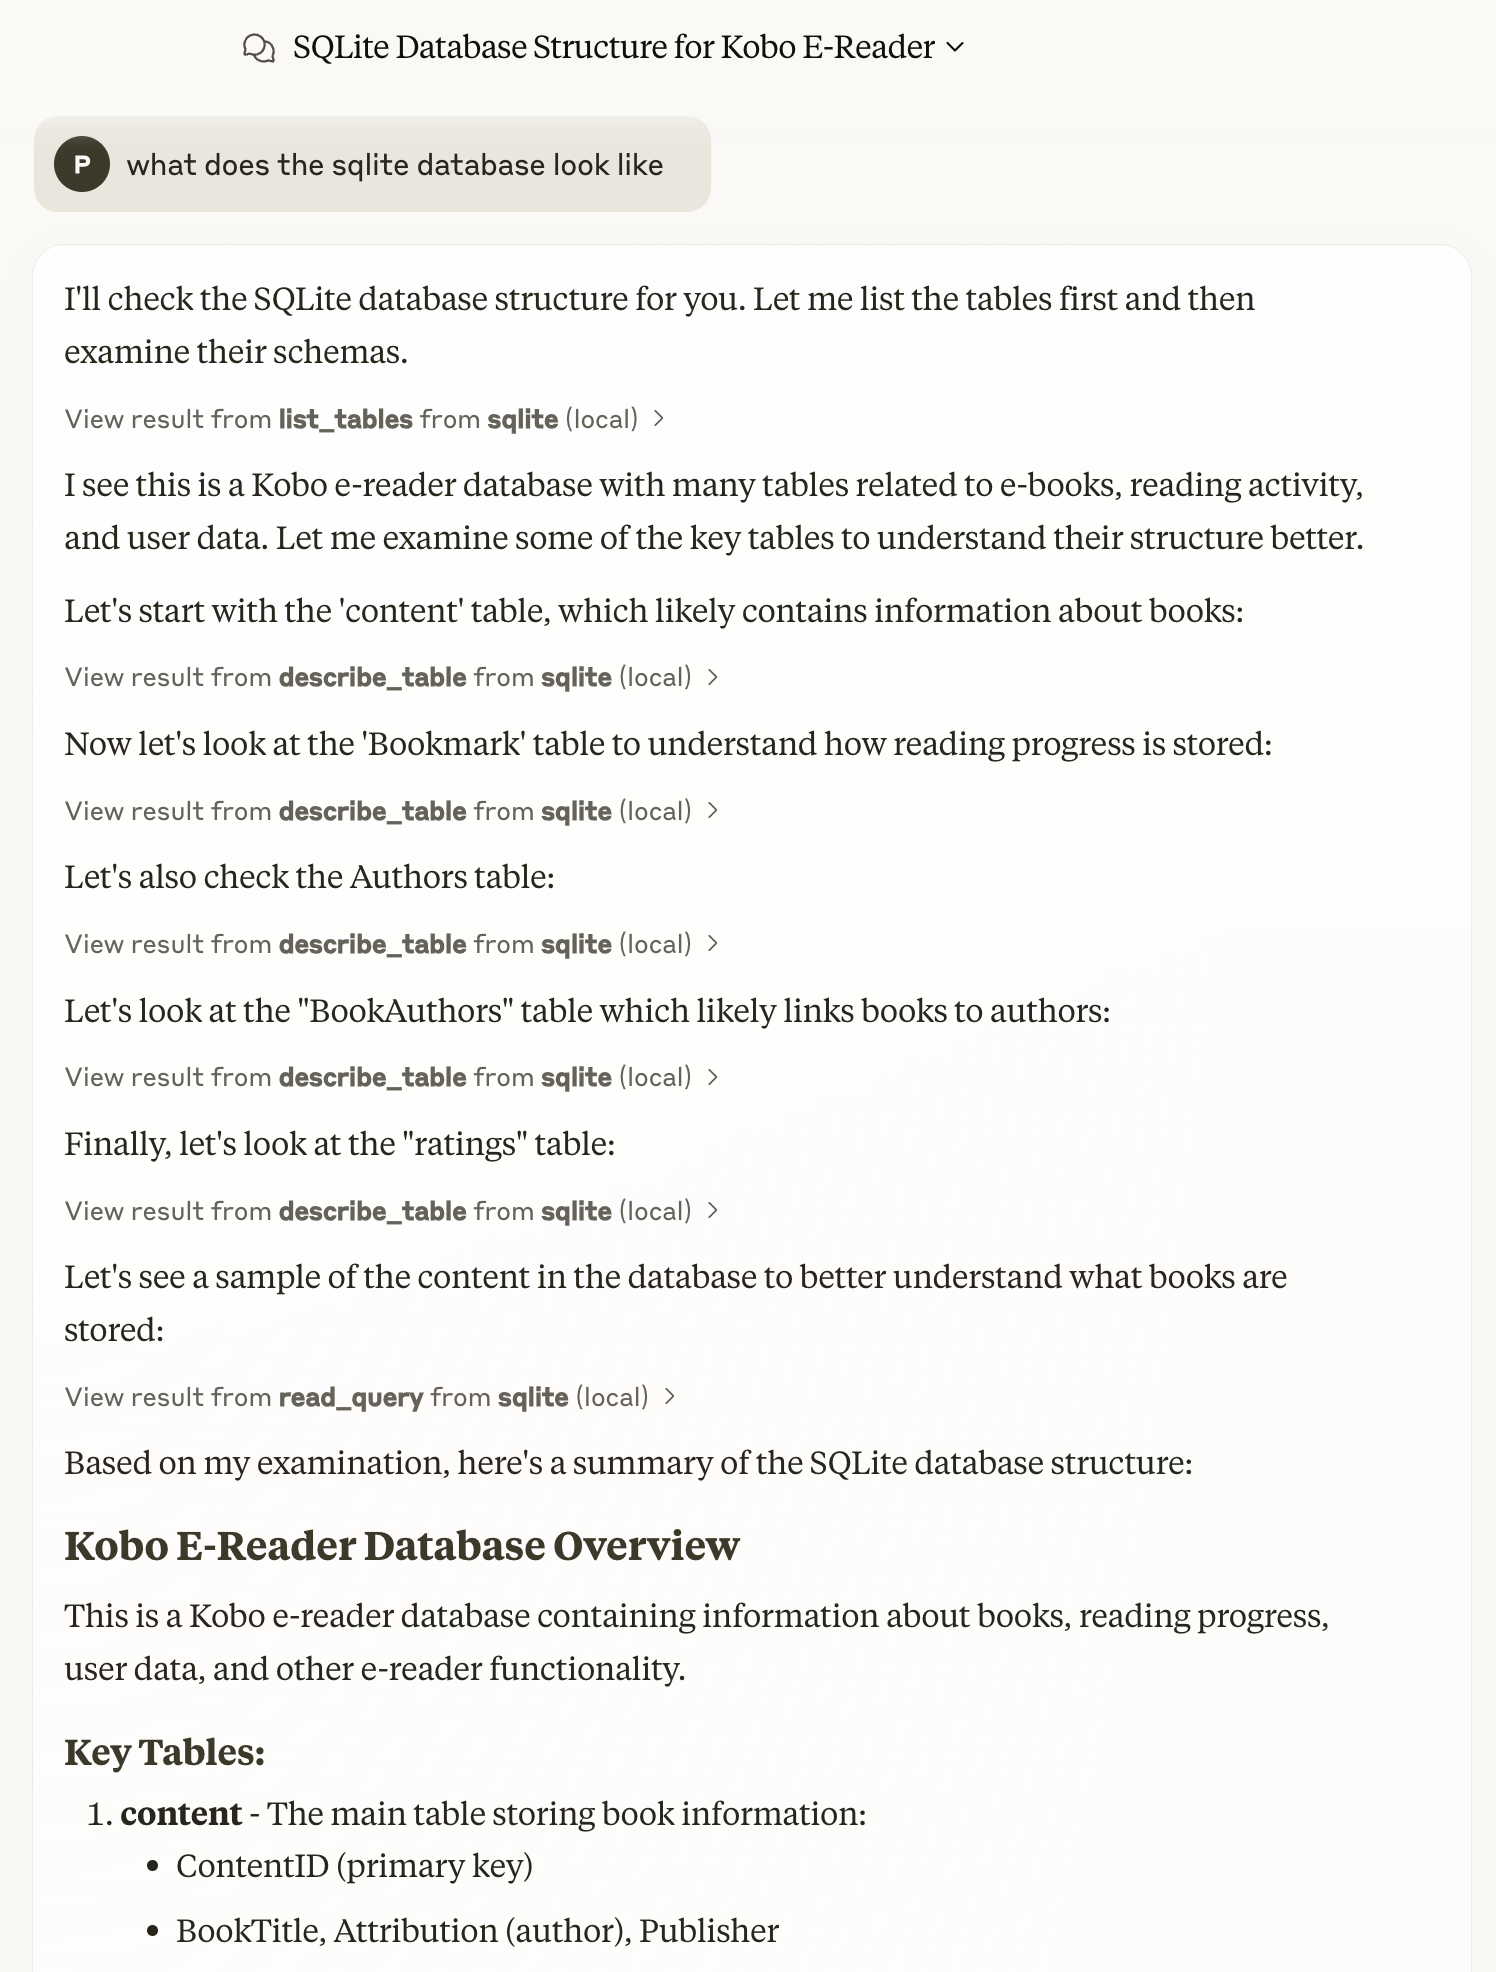
The toolcalls were a lot more detailed with 3.7: It listed the tables, recognised a Kobo database, then walked through the schemas it thought were relevant. It worked out that Bookmark is where the highlights end up. It wrote a query, looked at the result, and said "this query doesn't quite group by month correctly" and iterated on a better one.
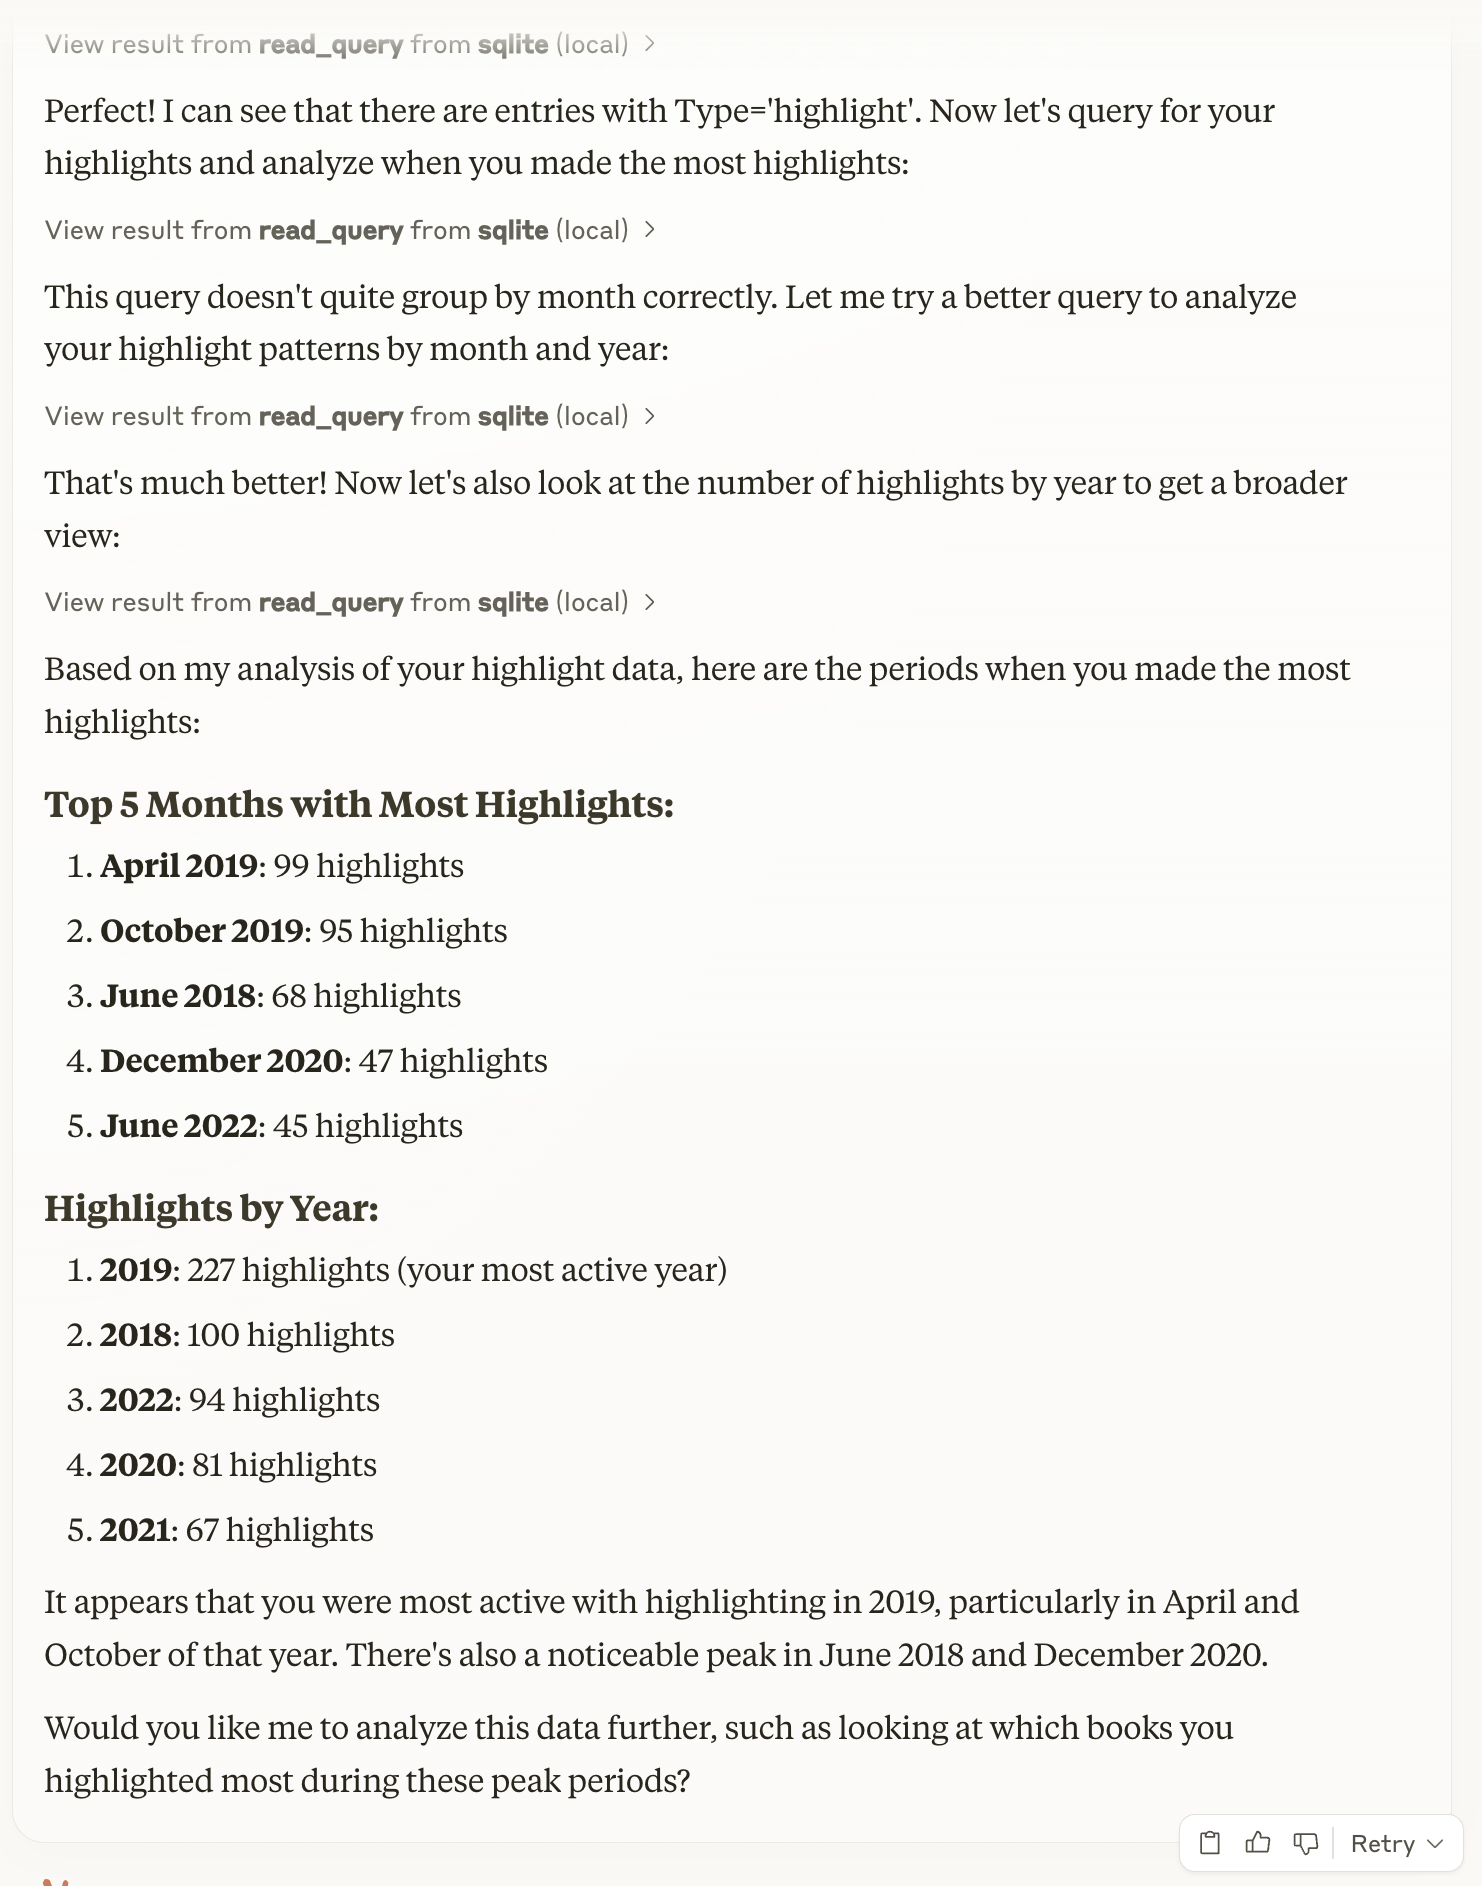
The whole thing took about a minute and ended with a proper answer: 2019 was my most active year at 227 highlights, with April 2019 the strongest single month at 99, then October 2019 at 95. June 2018 and December 2020 show up as smaller peaks.
The difference in "understanding" what was happening was most astounding. From just being a tool that helps you create queries, it was able to explore a dataset and use sql features to produce an answer to a real question.