- Published on
Server health insight with NewRelic and ansible
- Authors

- Name
- Peter Peerdeman
- @peterpeerdeman
With the number of servers and applications in maintenance of my company growing it became time to find a decent solution that keeps tabs on the health of our servers. Though there are open source solutions available such as graphite that will gather and graph data collected with open source statistics gatherers like collectd it is hard to beat the ease of use and functionality of Newrelic.
Newrelic is a cloud platform that offers realtime server statistics graphing, application inspection, an elaborate alert triggering system and an easy to install daemon that will get you started with monitoring your servers in no-time.
We are using the following ansible script to install newrelic on any machine we deploy to, independent of it being a staging, acceptance or production environment:
#/devops/provision/roles/common/tasks/newrelic.yml
---
- name: newrelic | add apt repository
  shell: echo deb http://apt.newrelic.com/debian/ newrelic non-free > /etc/apt/sources.list.d/newrelic.list
  tags: newrelic

- name: newrelic | trust GPG key
  shell: wget -O- https://download.newrelic.com/548C16BF.gpg | apt-key add -
  tags: newrelic

- name: newrelic | install
  apt: package=newrelic-sysmond state=latest update_cache=yes
  tags: newrelic

- name: newrelic | set license key
  shell: nrsysmond-config --set license_key={{ common.newrelic.license_key }}
  tags: newrelic

- name: newrelic | start daemon
  shell: /etc/init.d/newrelic-sysmond start
  tags: newrelic
with the license key being supplied from the (ansible-vault encrypted) group_vars folder environment specific file.
#/devops/provision/group_vars/production.yml
---
common:
newrelic:
license_key: <insert new relic license here>
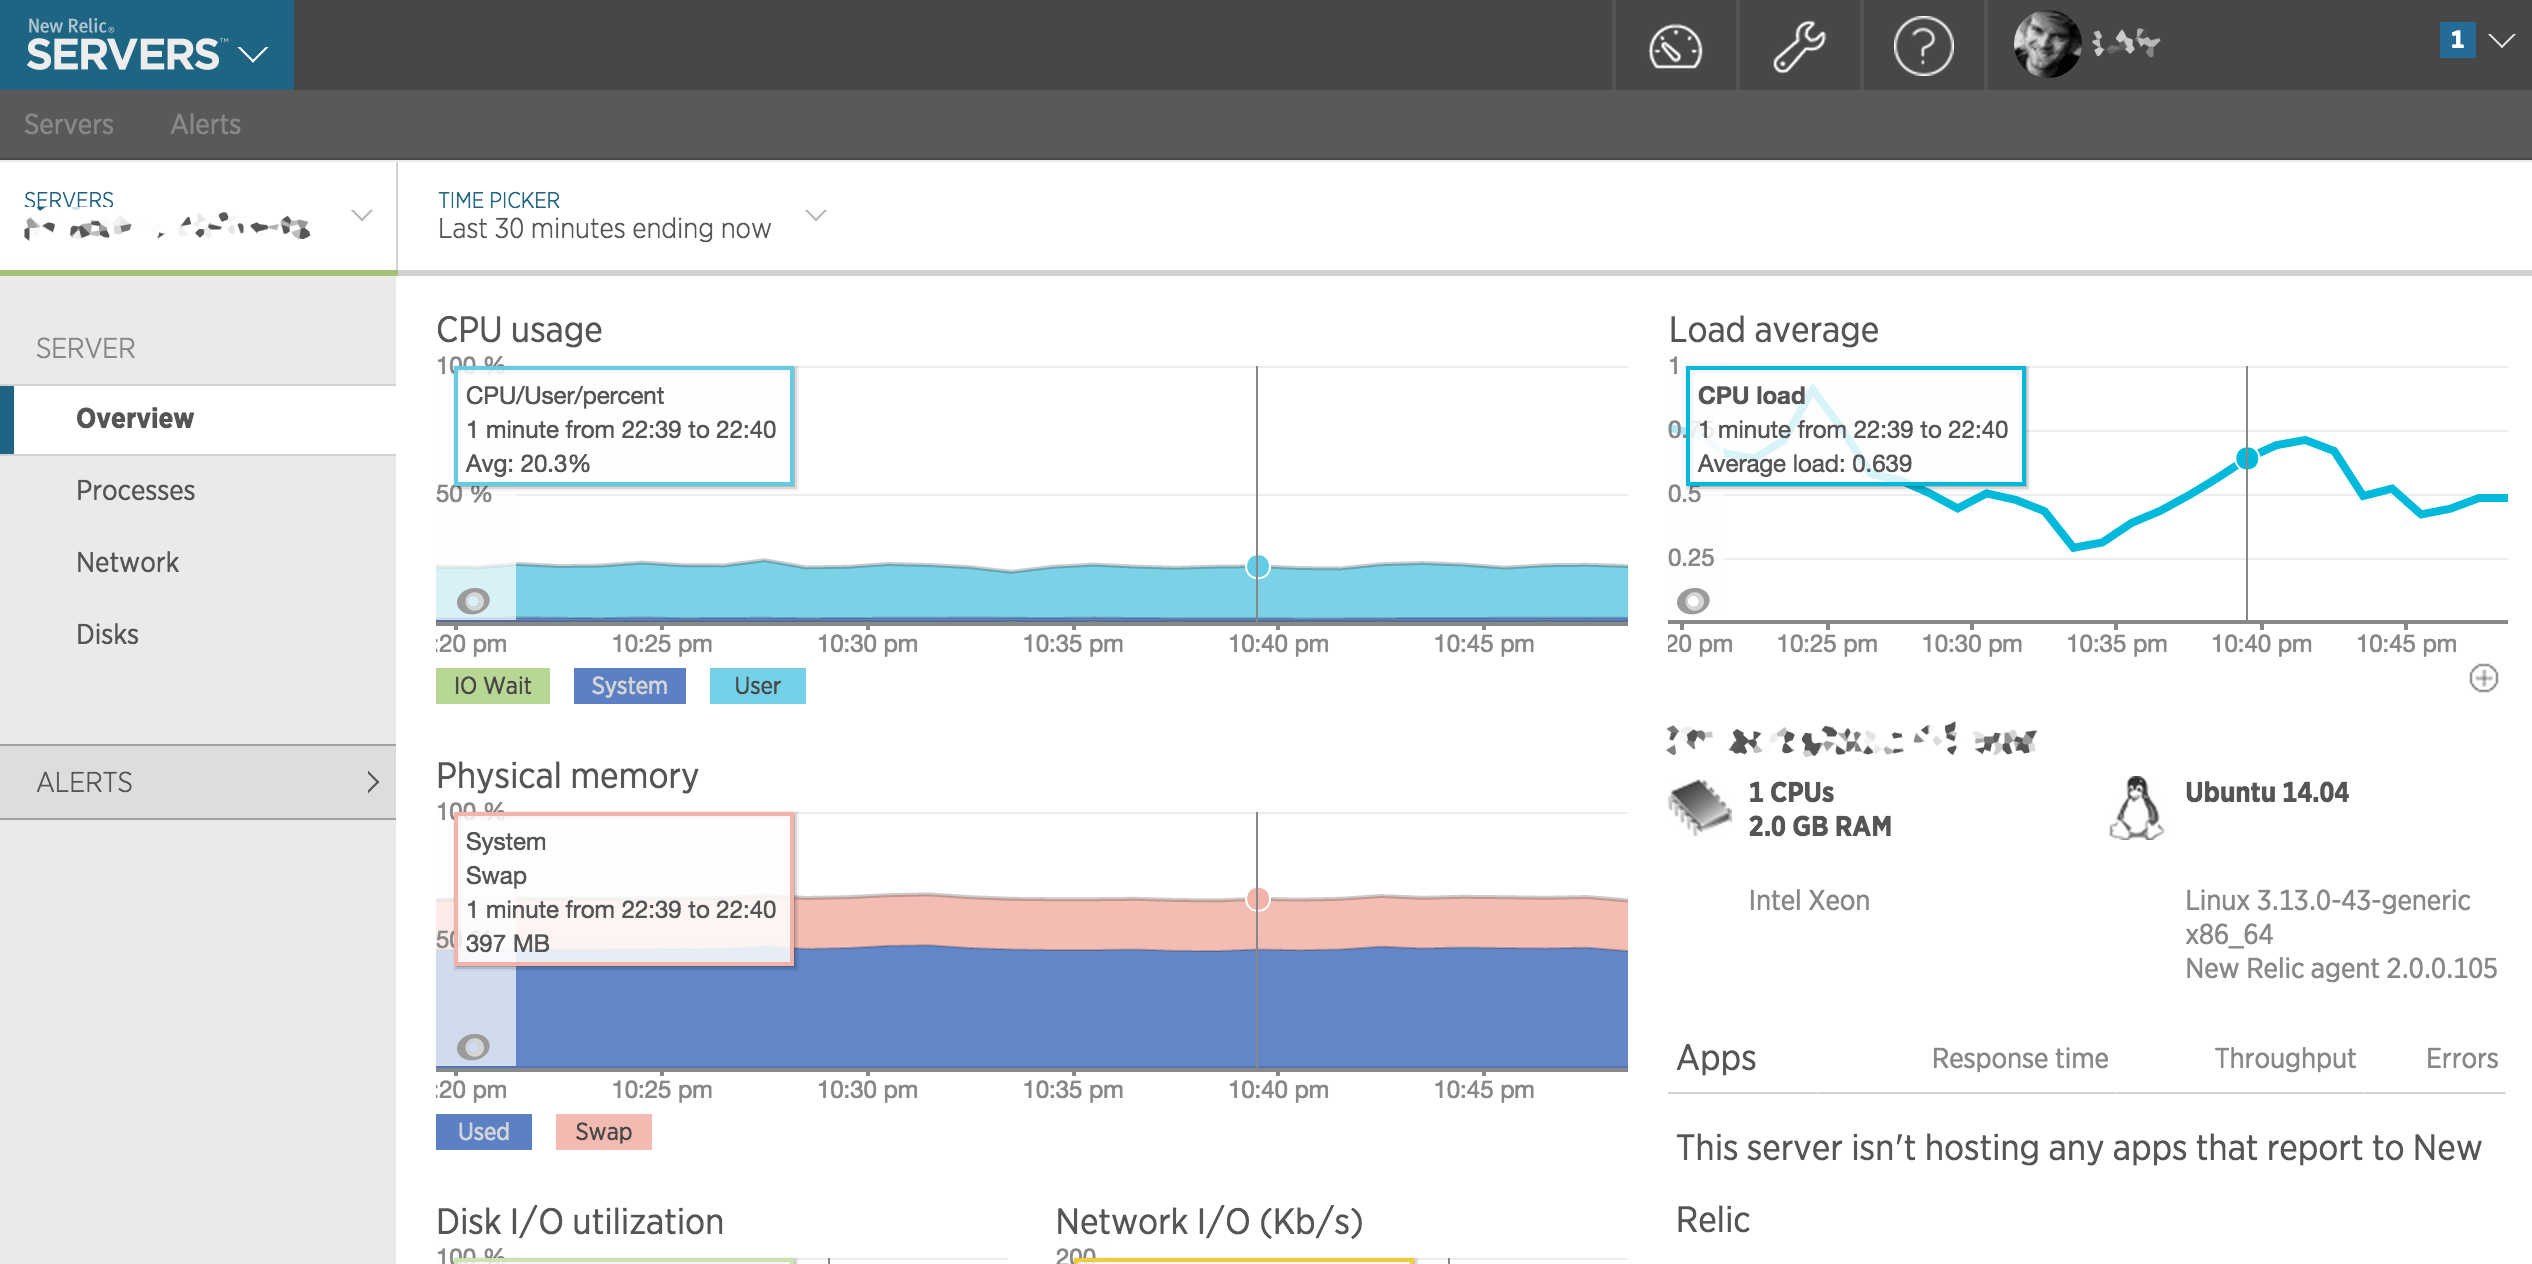
Once the daemon is running and sending its data to newrelic you can inspect your webservers through their web application. Statistics like CPU load, memory usage and diskspace can be monitored with ease and configuring the thresholds for when to trigger an email alert / slack notification is a breeze.
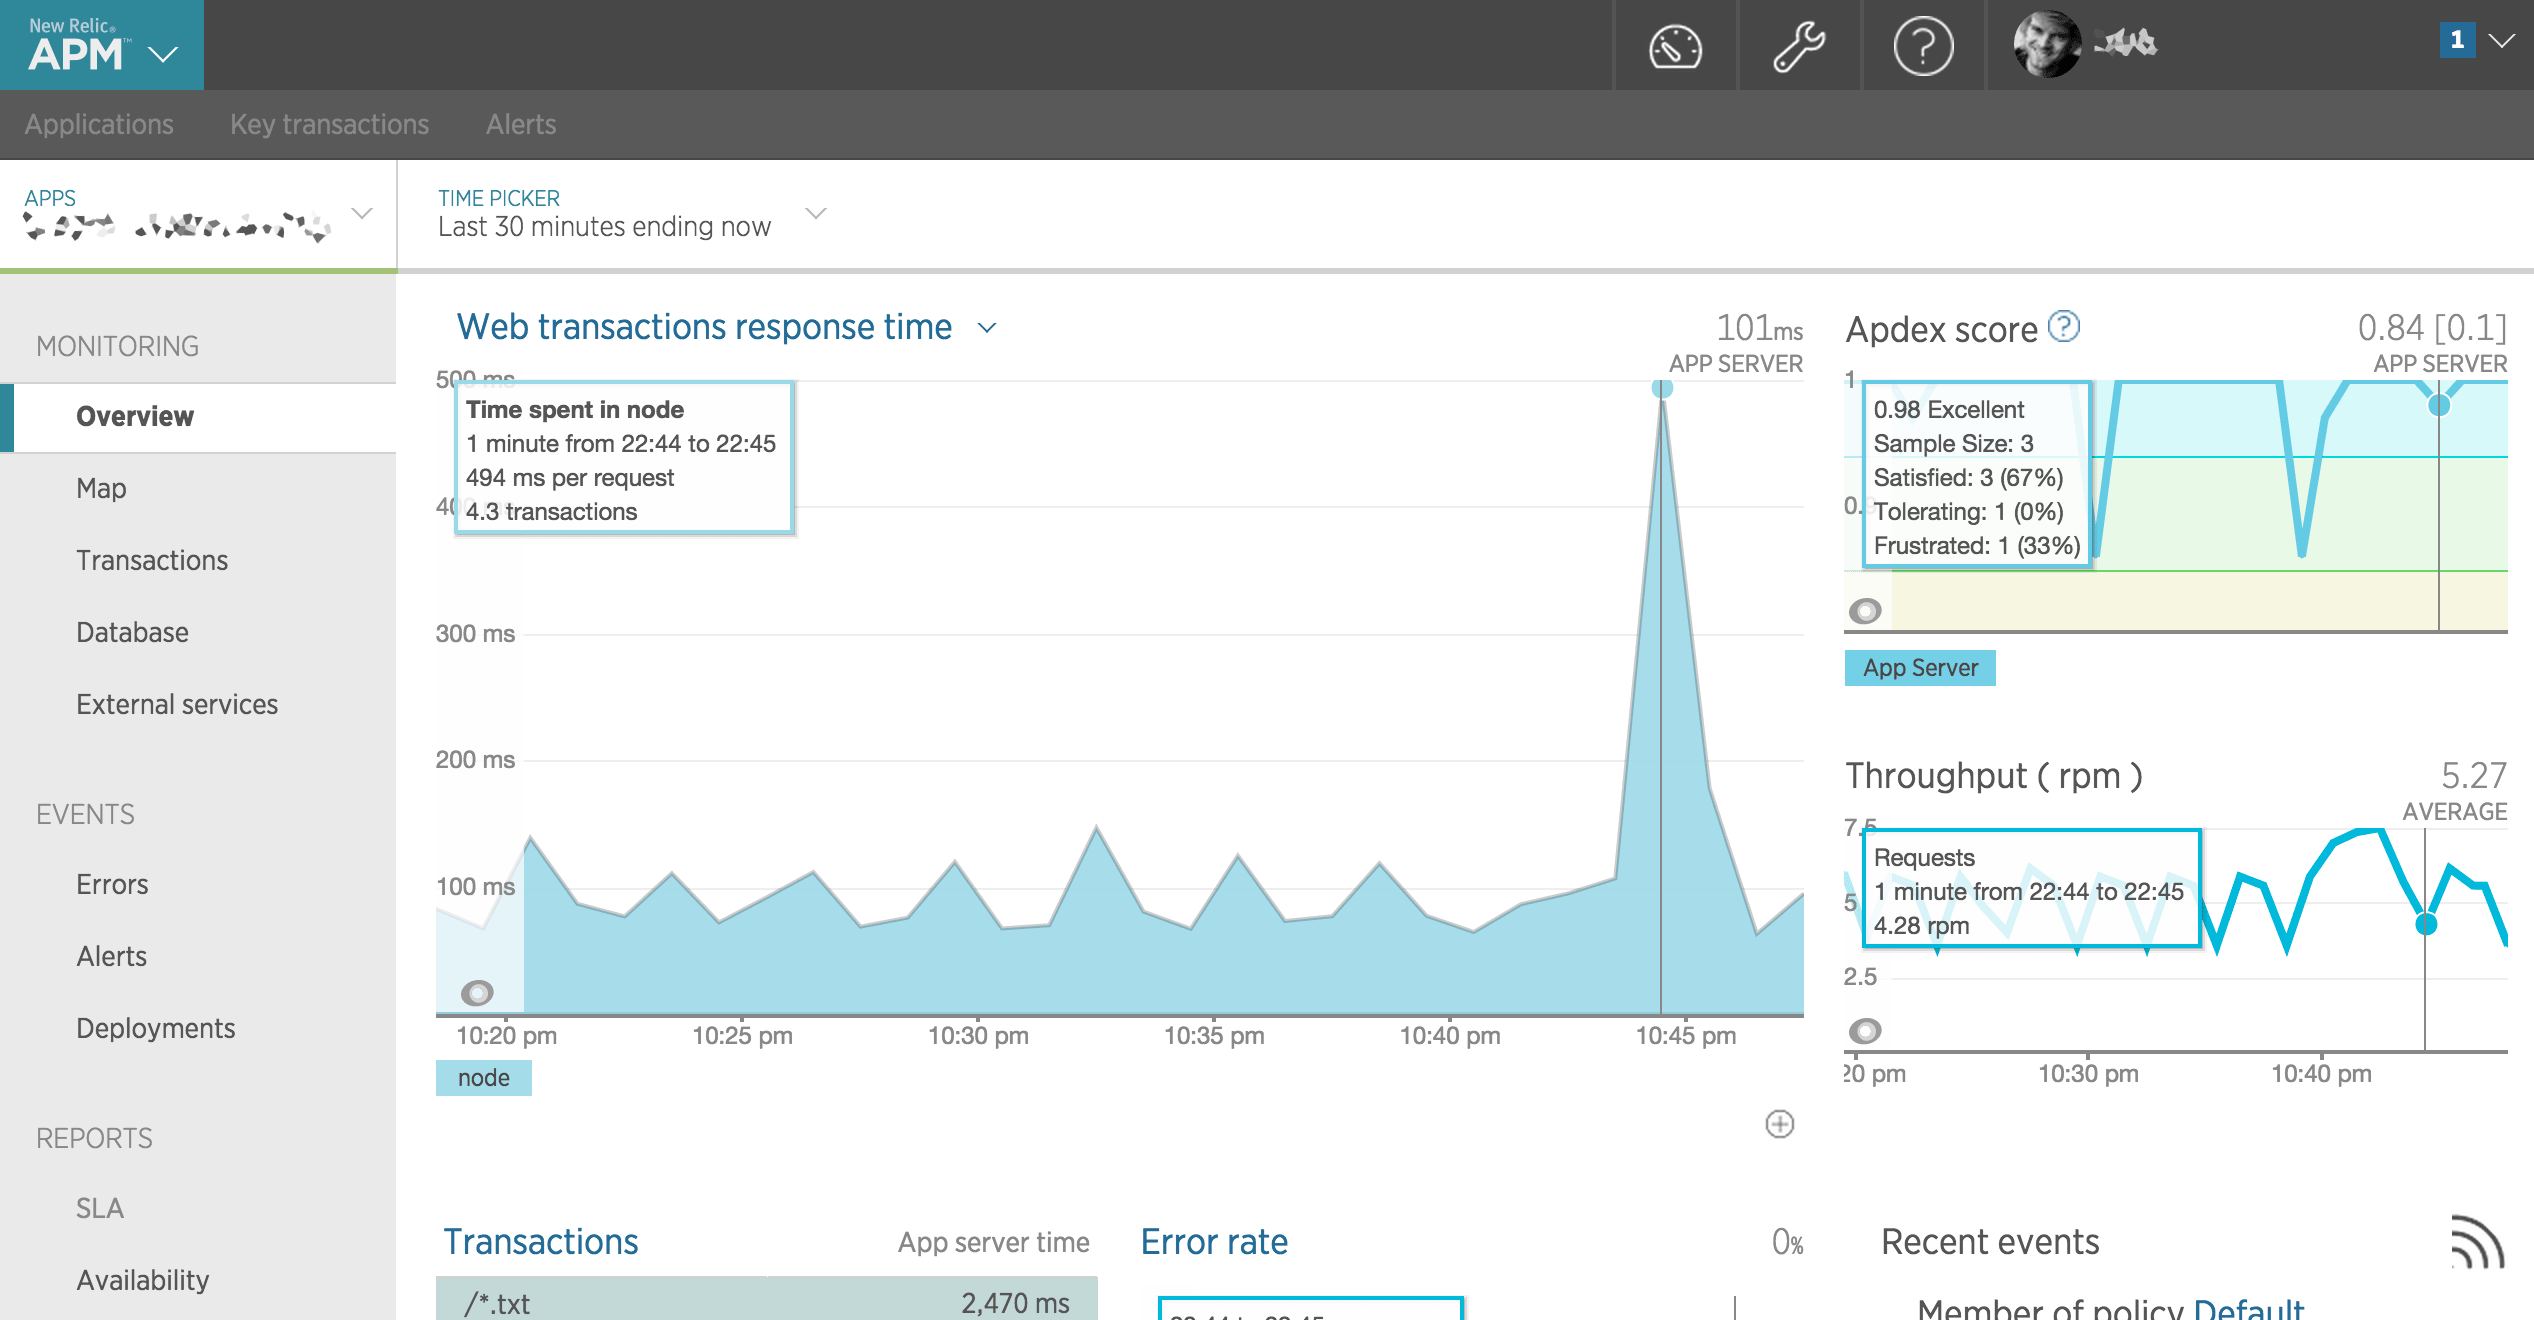
New relic offers several libraries that can be included into your application code as well which allows even deeper inspection. We are using the node library integration that shows responsetimes for different endpoints, API throughput and an Appdex score based on your services availability.
The basic subscription is free to use and is a great way to get started getting more grip on the uptime of your infrastructure!